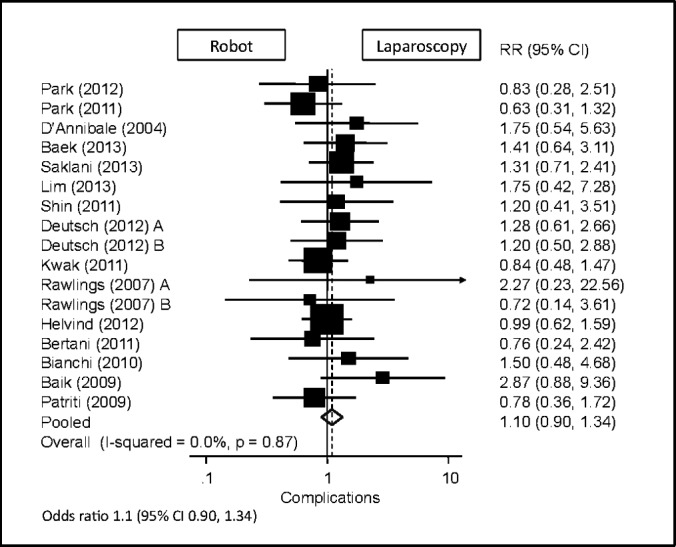
Figure 10.

Forest plot and pooled analysis of odds ratio for total overall complications between robotic and laparoscopic approaches. The odds ratio for total overall complications is reported for each study (black square) along with its 95% confidence interval (CI) (horizontal lines). The size of the square represents the weighted contribution of each study, and the diamond in the last line represents the pooled estimate and its 95% CI (width of diamond).
