
Figure 4. Area-level mapping of cortex in macaques and humans.
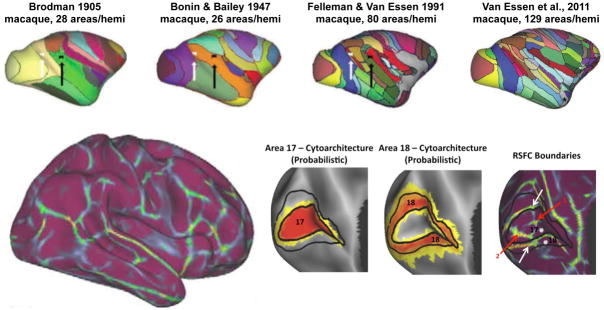
At top, several macaque cortical parcellation schemes show the refinement of area-level maps over the last century, modified from (Van Essen et al., 2012a). At bottom, a parcellation of the human cortex based on resting state functional connectivity. The insets show postero-medial views of the occipital lobe of the left hemisphere, with cytoarchitectonic locations for Brodmann areas 17 and 18, and corresponding resting state boundaries. The white arrows denote borders that align well with the predicted area borders, and the red arrows denote boundaries that may be byproducts of unremoved artifact at the occipital pole. Modified from (Wig et al., 2014b).