


Fig 2.
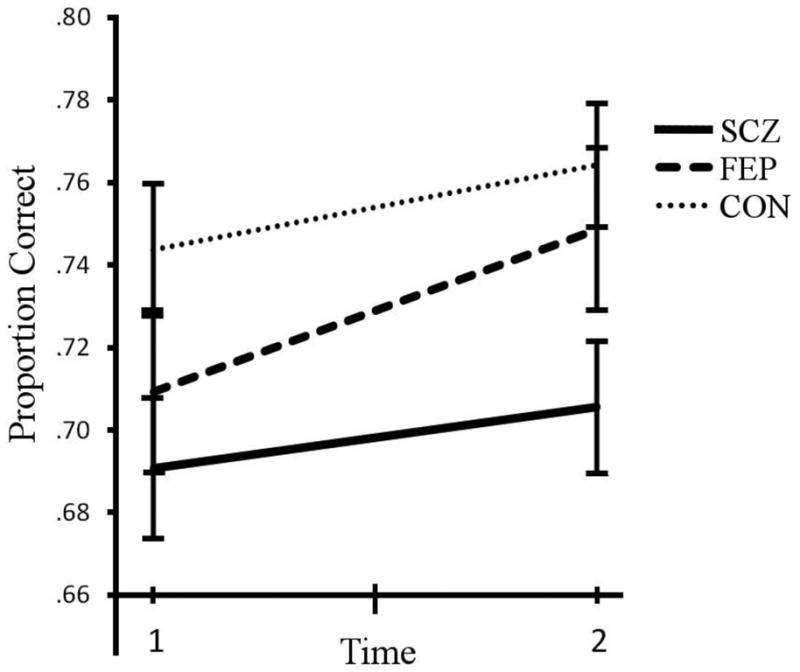
Contour Integration task accuracy at admission and discharge for the first episode group (FEP), schizophrenia group (SCZ), and healthy control group (CON). Performance corresponds to the proportion correct (where timed-out trials count as 0.5 correct). Error bars are standard error of the mean. There is a significant difference between the CON and SCZ groups across and at both times. Times 1 and 2 for patients corresponded roughly to admission and discharge to the inpatient unit, respectively. This chart does not depict subjects who dropped out of the study between Times 1-2.