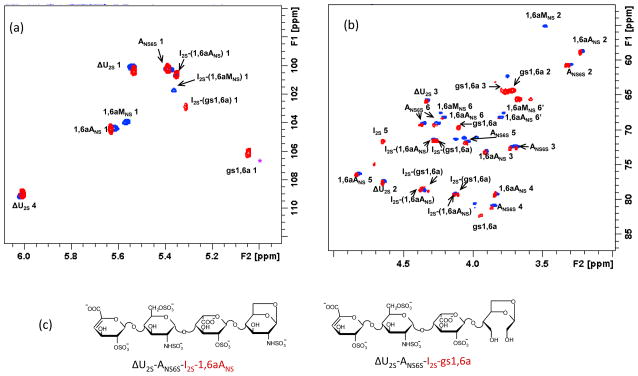
Figure 4.
HSQC spectra of ΔU2S-ANS6S-I2S-1,6aANS and ΔU2S-ANS6S-I2S-1,6aMNS mixture before (blue spots) and after (red spots) periodate/borohydride treatment
(a) – anomeric region, (b) – “ring” region. In panel (c) the structures of the unaffected tetrasaccharide ΔU2S-ANS6S-I2S-1,6aANS and the gs one ΔU2S-ANS6S-I2S-gs1,6a are shown. The first two residues ΔU2S and ANS6S within their sequence (cross-peaks shown in black) show very similar chemical shifts in the anomeric region of the spectrum, whereas the I2S and terminal 1,6aMNS/1,6aANS (shown in red) differ from each other. Chemical shifts of I2S residues differ from each other due to the so-called “sequence effect”

