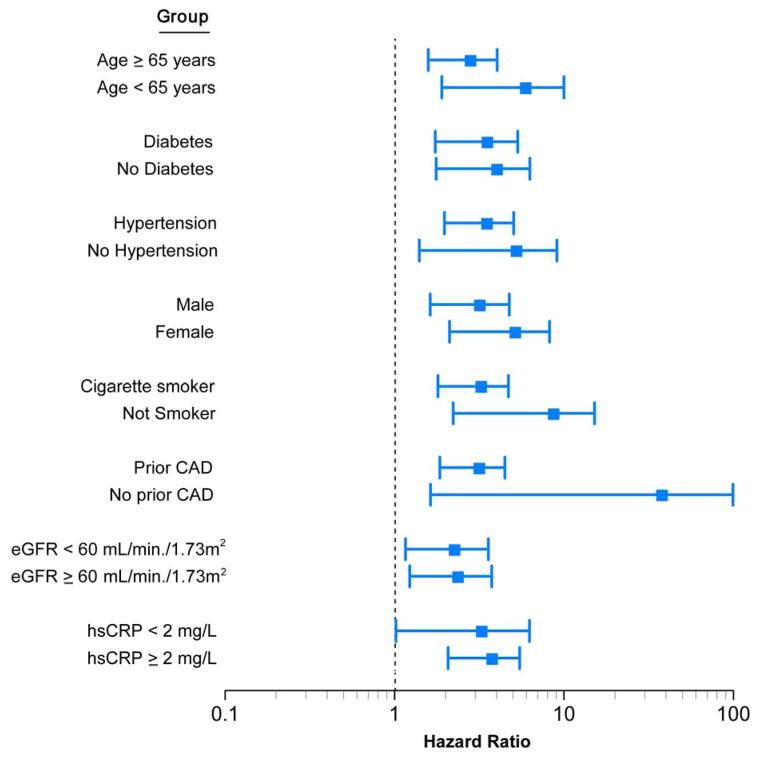
FIGURE 2. Relationship between Plasma TMAO Concentration and Mortality Risk Stratified According to Baseline Characteristics.
Forest plot of the hazard ratio (squares) of 5-year all-cause mortality risk comparing first and fourth quartiles of fasting plasma TMAO levels. Bars represent 95% confidence intervals. The wide confidence intervals in some subgroups are in part due to their small sample sizes and event rates. CAD = coronary artery disease; eGFR = estimated glomerular filtration rate; hsCRP = high-sensitivity C-reactive protein.

