
Table 5.
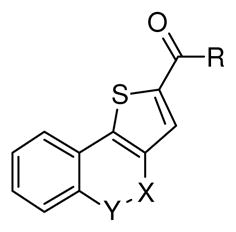
In-vitro CDK5/p25 and CDK2/E assay of SAR compounds
| |||||||
|---|---|---|---|---|---|---|---|
| Compound | R | X | Y | CDK5/p25 inhibition @50μMa | CDK5/p25 IC50 (μM)a,b | CDK2/E inhibition @50μMa | CDK2/E IC50 (μM)a,b |
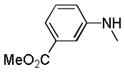
| 24 | -OCH3 | C=O | NH | 48.2% | 58.1 | 7.9% | |
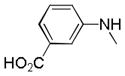
| 25a | -NH2 | C=O | NH | 29.0% | 21.8% | ||
| 25b | -NH(iPr) | C=O | NH | No inhibition | 12% | ||
| 25c | -NH(cyPr) | C=O | NH | No inhibition | 10% | ||
| 25d | -NH(cyHex) | C=O | NH | No inhibition | No inhibition | ||
| 25e | -NH(1-adamentyl) | C=O | NH | No inhibition | No inhibition | ||
| 25f |
|
C=O | NH | 24.9% | 15.9% | ||
| 25g |
|
C=O | NH | 16.6% | 8.8% | ||
| 25h |

|
C=O | NH | 23.3% | 12.3% | ||
| 25i |
|
C=O | NH | 15.3% | 4.9% | ||
| 25j |
|
C=O | NH | 13.1% | 6.5% | ||
| 25k |
|
C=O | NH | 12.8% | 3.7% | ||
| 25l |

|
C=O | NH | 83.8% | 29.2 | 72.2% | 35.3 |
| 25m |
|
C=O | NH | 87.5% | 5.2 | 58.7% | 27.4 |
| 25n |

|
C=O | NH | 61.7% | 15.6 | 42.7% | 53.8 |
| 25o |
|
C=O | NH | 87.7% | 3.6 | 82.41% | 35.4 |
| 25p |
|
C=O | NH | No inhibition | No inhibition | ||
| 25q |
|
C=O | NH | No inhibition | No inhibition | ||
| 25r |

|
C=O | NH | 89.9% | 3.0 | 74.8% | 25.5 |
| 25s |

|
C=O | NH | 70.6% | 4.3 | No inhibition | |
| 25t |
|
C=O | NH | 93.6% | 1.6 | 97% | 6.3 |
| 25u |
|
C=O | NH | 27.4% | No inhibition | ||
| 25v |

|
C=O | NH | 89.9% | 4.3 | 86% | 9.9 |
| 25w |

|
=C-Cl | N | 75.4% | 3.8 | 21.8% | |
| 25x |

|
C=O | NH | 80.7% | 10.6 | 36.7% | |
a
Assays were performed @ ATP (Km) concentrations (30 μM for CDK5/p25 and 65 μM for CDK2/E) and at least two independent experiments were performed to generate the average values
b
Gap signifies IC50 could not be determined because of very low % inhibition at 50 μM