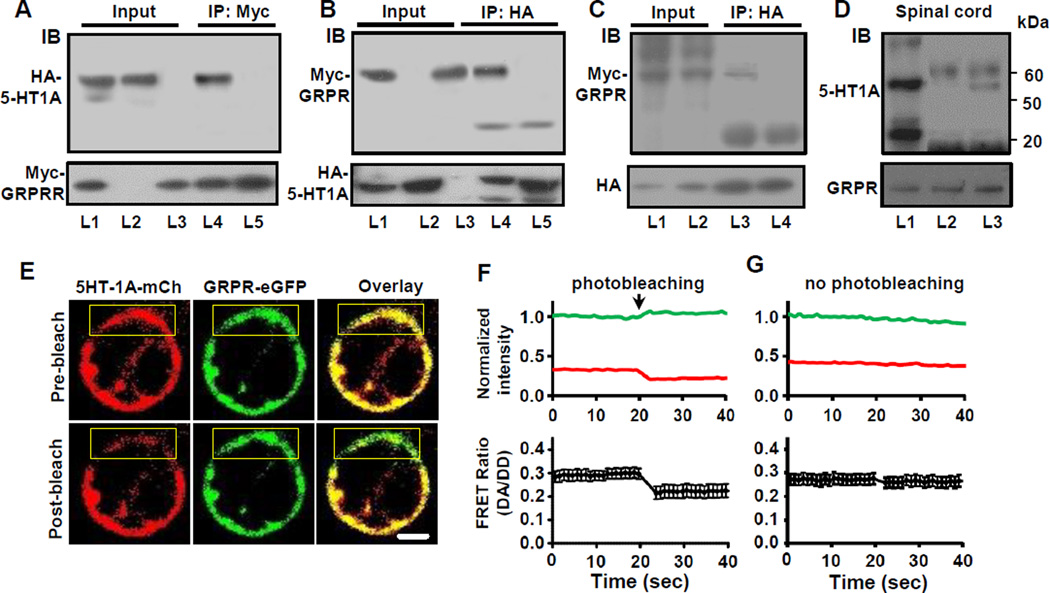
Figure 5. GRPR and 5-HT1A Form Heteromeric Complexes and Are within Close Proximity.
(A and B) Co-IP of HA-5-HT1A and Myc-GRPR. L1 and L4, HA-5-HT1A/Myc-GRPR cells; L2, HA-5-HT1A cells; L3, Myc-GRPR cells; L5, mixture of L2 and L3.
(C) Myc-GRPR was not co-immunoprecipitated with HA-5-HT1B. L1, L3, HA-5-HT1A/Myc-GRPR cells; L2, L4, HA-5-HT1B/Myc-GRPR cells.
(D) Co-IP of 5-HT1A and GRPR from the spinal cord membrane preparations. L1, input; L2, irrelevant mouse IgG; L3, mouse anti-GRPR.
(E) Representative confocal images show one HEK 293 cell co-expressing 5HT1A-mCherry (red) and GRPR-eGFP (green), before and after acceptor (mCherry) photobleaching in selected region of the cell (yellow box). Scale bar, 10 µm.
(F) Top: Plots showing background subtracted normalized fluorescence intensities of donor emission (green trace, 488 nm excitation, 515 nm emission: DD) and acceptor emission (red trace, 488 nm excitation, 630 nm emission: DA) from selected plasma membrane region in E. Bottom: Averaged FRET ratio (DA/DD) of the photobleached regions in E.
(G) Background subtracted normalized fluorescence intensities (top) and averaged FRET ratio (bottom) of non-photobleached plasma membrane regions in E.
Number of cells, n = 9–11. Error bars represent SEM. See also Figures S5 and S6.

