
Figure 6. Global changes in 5mC patterns resulting from DNMT3B siRNA depletion mimic methylation changes during differentiation.
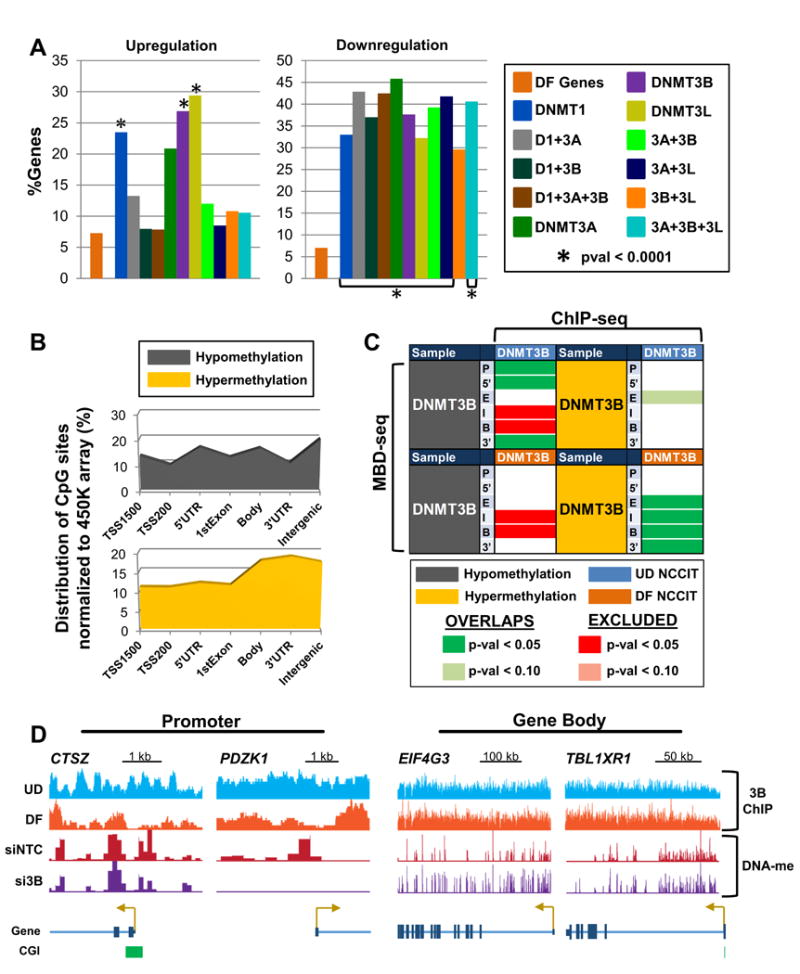
(A) Overlap analysis of DNMT knockdown differentially expressed genes (≥ 1.5 fold-change) with differentially expressed genes in differentiating (DF) NCCIT cells (following 7 days of retinoic acid treatment). ‘DF Genes’ (orange bar) represents the percentage of genes in differentiated NCCIT cells that are differentially expressed. The ‘%Genes’ for siDNMT depleted samples represents the percent overlap of differentially expressed genes among the respective siDNMT depleted sample with genes differentially expressed in differentiated NCCIT cells. (B) Normalized distribution of significantly differentially methylated CpG sites (pval < 0.05) by genomic feature in NCCIT DF cells. (C) Overlap analysis of genes with ≥ 4-fold 5mC changes (by MBD-seq) for the indicated features with DNMT3B binding (ChIP-seq) in NCCIT undifferentiated (UD) and differentiated (DF) cells. (D) Representative browser views of promoters displaying hypomethylation upon DNMT3B depletion, are bound by DNMT3B in UD NCCIT cells, and become hypomethylated upon differentiation (left). Gene body hypermethylation with DNMT3B depletion coincides with sustained binding of DNMT3B in DF NCCIT cells (right). See also Figure S6.