
Figure 7. Knockout and ectopic expression of DNMT1 and DNMT3B in HCT116 colorectal carcinoma cells reveals conserved modes of regulating 5mC among.
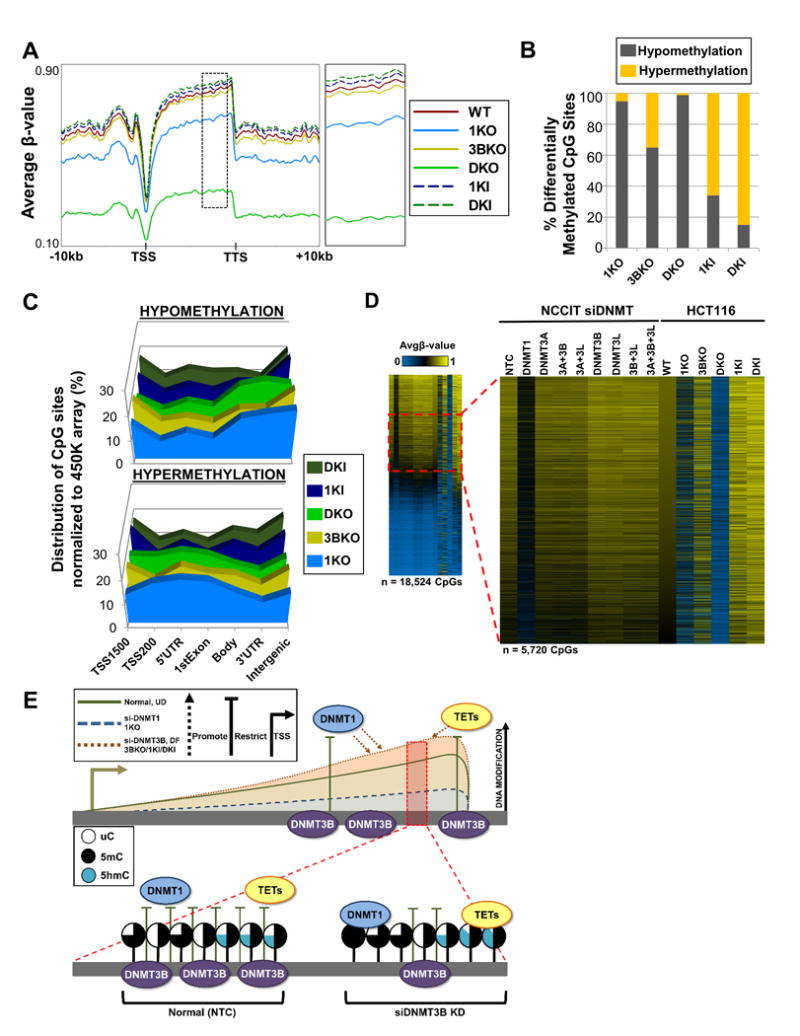
(A) Spatial distribution plots across intragenic regions derived from average β-values for 5mC in HCT116 DNMT1/DNMT3B knockout (KO) and overexpressing (KI) cells derived from the 450K array. Dashed black box (to the right) indicates region magnified. (B) Percent of significantly differentially methylated CpG sites (pval < 0.05) classified by methylation status. (C) Normalized distribution of significantly differentially methylated CpG sites by genomic feature in HCT116 KO/KI cells. (D) Heat map of hypermethylated (Δβ ≥ 0.15) CpG sites for HCT116 KO/KI cells in conjunction with the respective CpG loci in NCCIT DNMT siRNA depleted samples stratified by HCT116 WT most methylated to least methylated CpG sites. Dashed red box indicates magnified region (Avgβ-value [0.50 – 0.70] in WT). Duplicate CpG sites were removed. (E) DNMT3B restricts DNMT1 and TET function at certain loci. Conserved loci were identified in NCCIT DNMT3B depletion, NCCIT differentiation, and HCT116 3BKO, 1KI, and DKI conditions that gain DNA modifications (5mC and 5hmC); these same loci significantly overlap with CpGs that become hypomethylated with DNMT1 depletion, indicating a regulatory interaction. Additionally, in NCCIT cells depleted of DNMT3B, 5hmC increases at these loci indicating that TETs are also recruited. Shaded lollipops indicate the level of each cytosine modification (uC = unmodified cytosine; 5mC = 5-methylcytosine; 5hmC = 5-hydroxymethylcytosine). See also Figure S7.