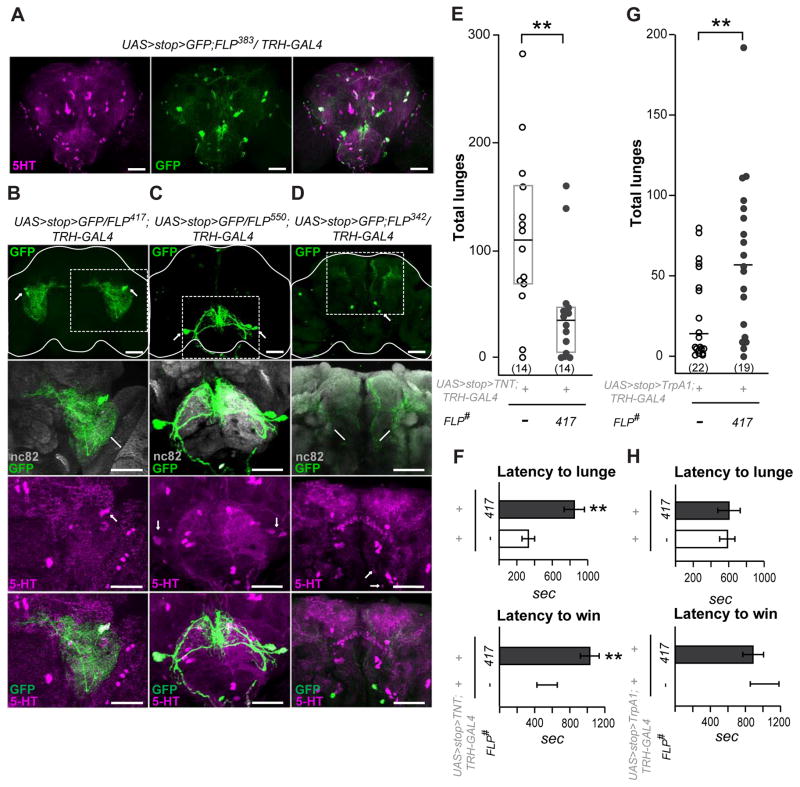
Figure 1. A single pair of serotonergic PLP neurons enhances aggression.
A–D. Serotonergic neurons identified by the enhancer trap (et)-FLP screen.
A. Example of a broadly expressed FLP line that targets most of the 5HT neurons in the fly brain. The anti-5HT immunostaining pattern is shown in magenta, the membrane-tethered GFP signal driven by a combination of FLP383, TRH-Gal4 and UAS>stop>mCD8::GFP is shown in green. The full z-stack frontal projection is shown, scale bar represents 50 μm. B–D. Individual 5HT neurons targeted by the use of different et-FLP lines. The mCD8::GFP signal amplified by anti-CD8 antibody staining is shown in green, the neuropil areas stained by an nc82 (anti-Bruchpilot) antibody are shown in gray, and anti-5HT immunostaining is shown in magenta. Dotted boxes outline the magnified fields shown in the lower panels. The upper panels show full frontal projections, scale bar represents 50 μm. Different frontal z-stacks through either the anterior or posterior areas of the same triple-stained brains were created when required to view the processes or cell bodies shown in the lower panels. B. The FLP417 line restricts GFP expression to 1–2 bilateral neurons from the PLP cluster (green). These neurons arborize within the ventrolateral protocerebrum (VLP) and send a midline directed process toward the central complex (see Figure 3A for more details). C. The FLP550 line restricts GFP expression to 1–2 bilateral neurons from the SE1 cluster (green). These arborize within the suboesophageal ganglion (SOG) and send descending projections to the ventral nerve cord. D. The FLP342 line restricts GFP expression to 1–2 bilateral neurons from the PMP cluster (green) that arborize in the superior medial protocerebrum.
For et-FLP lines reproducibility and cell count data see Table S1.
E–H. Manipulation of individual 5HT neurons from the PLP cluster targeted by FLP417 changes aggression. E. Total numbers of lunges performed by pairs of males with TNT-inactivated 5HT-PLP neurons. F. Latency to the first lunge and to the establishment of dominance in flies with TNT-inactivated 5HT-PLP neurons.
In E and F both genetic control and experimental flies were reared and fought at constant +25°C conditions. Note, that the reduction in lunge numbers was not due to the increased latency to lunge, because the number of lunges counted for 30 min after the first lunge rather than from the time of landing on the food surface, was also reduced [FLP417: 74.2 ± 17.5; controls: 134.9 ± 22.0, Mann-Whitney U=54, P=0.043].
G. Total numbers of lunges performed by pairs of males with dTrpA1-activated 5HT-PLP neurons. H. Latency to the first lunge and to the establishment of dominance in flies with dTrpA1-activated 5HT-PLP neurons.
In G and H both genetic control and experimental flies were reared at +19°C and transferred to a +27°C experimental room 15 min before the aggression assay.
Each dot in panels E and G represents the lunge count for an individual pair of flies. Data are presented as boxplots with a median line. The bottom and top of the box show the 25th and 75th percentile. Latencies in panels F and H are presented as means ± SEM. ** -p<0.01 vs. controls (white bar or white dots), analyzed by nonparametric two-independent-sample Mann-Whitney U-test. See Figure S1C for FLP parental control aggression data.

