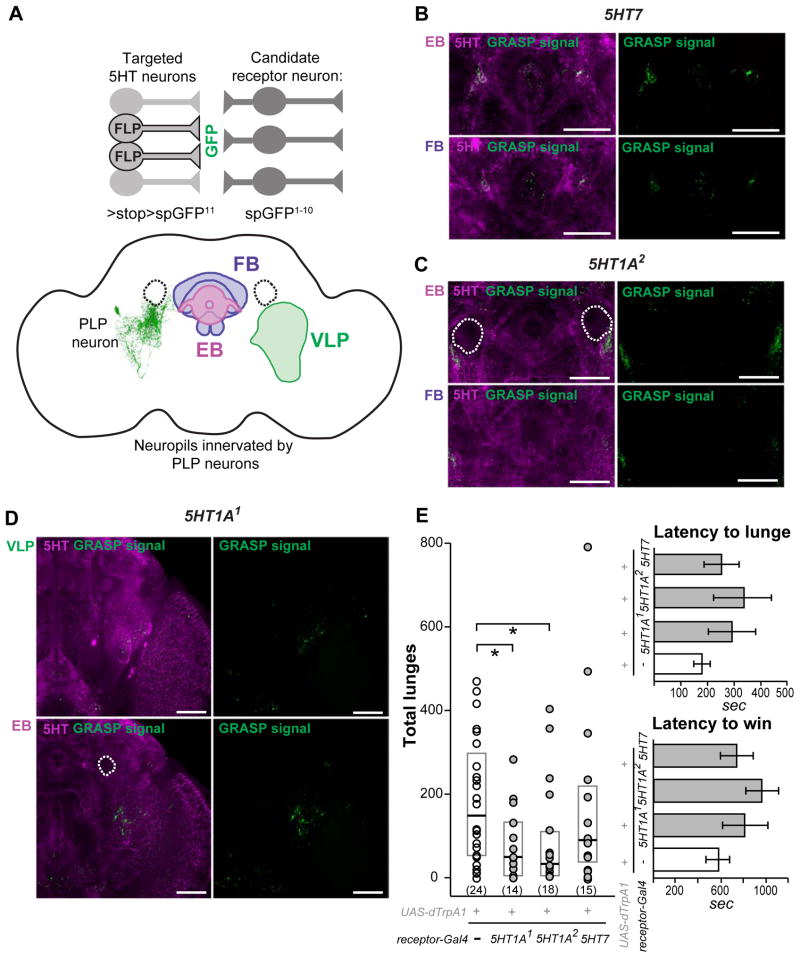
Figure 4. Putative targets of 5HT-PLP neurons determined using the anatomical and functional analyses.
A. A schematic illustration of the combined use of the GRASP and FLP-recombinase techniques to find possible synaptic connections between serotonergic neurons and target neurons that express different subtypes of 5HT receptors. We used the FLP210 line that targets most of the serotonergic neurons in the brain to restrict the expression of the spGFP11 part of GFP driven by the TRH-LexA. The other part of GFP, spGFP1–10, was expressed under control of different 5HT-receptor Gal4 drivers. We found GRASP signals in 3 neuropil regions where arborization of 5HT-PLP neurons was observed: ventrolateral protocerebrum (VLP), around peduncles of the mushroom bodies at the ellipsoid body (EB) focal plane, and near fan-shaped body (FB).
The use of FLP417 line that further restricted the expression of the spGFP11 to aggression-modulating 5HT-PLP neurons yielded no detectable GRASP signals.
B–D: Patterns of reconstituted GFP (GRASP signal, green) between most of serotonergic neurons and candidate 5HT receptor neurons in the areas of interest, which are visualized by anti-5HT immunostaining (magenta). The experimental genotypes used were: w1118; LexAop>stop>spGFP11/FLP210; UAS-spGFP1–10, TRH-LexA/5HT receptor-Gal4. Different frontal z-projections of the image stack were created to view the corresponding neuropils of the same brain. The three neuropil regions (VLP, EB, and FB) were examined for each receptor type, but only regions that showed GRASP signal are shown. The dotted circles outline the peduncles of the mushroom bodies that were not stained by the anti-5HT antibody. White arrows point to areas in which GRASP signal is observed. Scale bar represents 50 μm. For positive and negative GRASP controls see Figure S2, for additional GRASP data see Figure S3. E. dTrpA1-induced activation of 5HT1A receptor neurons decreases the total numbers of lunges. Each dot represents the lunge count for an individual pair of flies. Data are presented as boxplots with a median line. The bottom and top of the box show the 25th and 75th percentile. *- P< 0.05 vs. corresponding control (white dots), analyzed by nonparametric two-independent-sample Mann-Whitney U-test. Latency to the first lunge and to the establishment of dominance in flies with dTrpA1-activated 5HT receptor neurons was not changed. The latencies are presented as means ± SEM.

