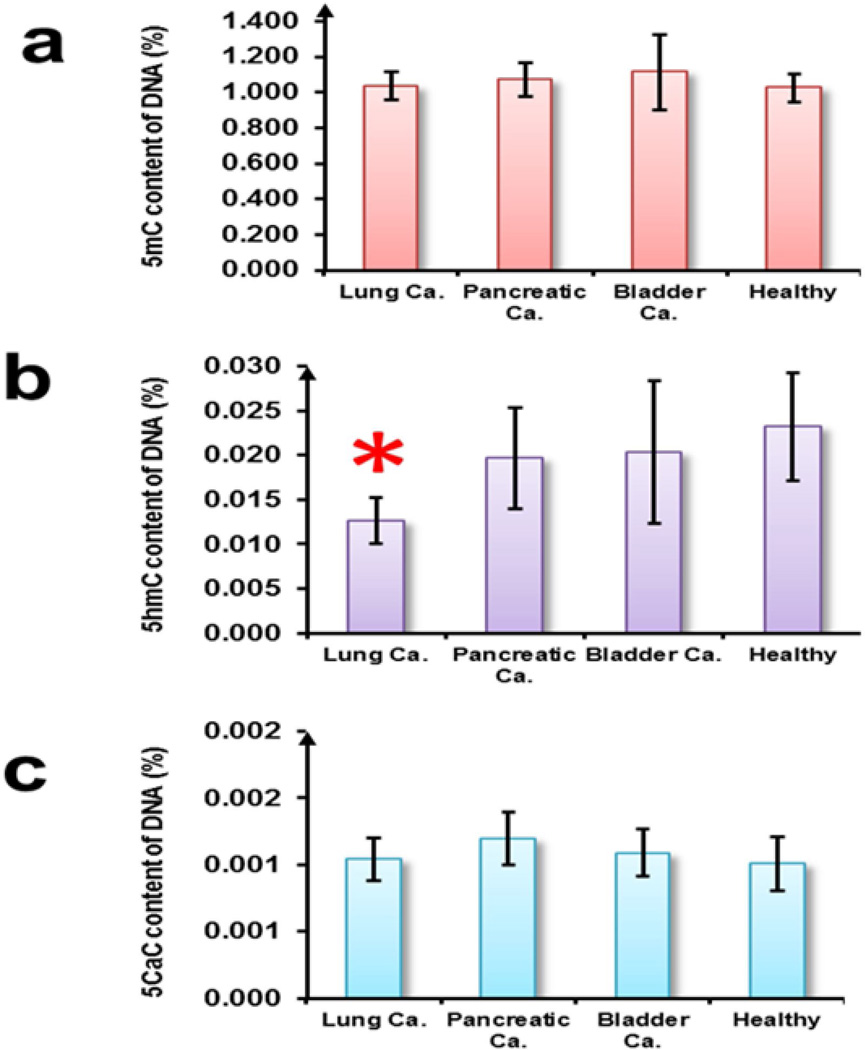
Figure 2. Quantification of epimarks in clinical biospecimens.
Mean global percentage of (a) 5mC, (b) 5hmC and (c) 5caC in the blood of the indicated groups of clinical samples (n=27). Error bars denote standard deviations between the clinical samples of each group. Star denotes significant difference in cancer biospecimens compared to healthy controls (p < 0.05, t-test).

