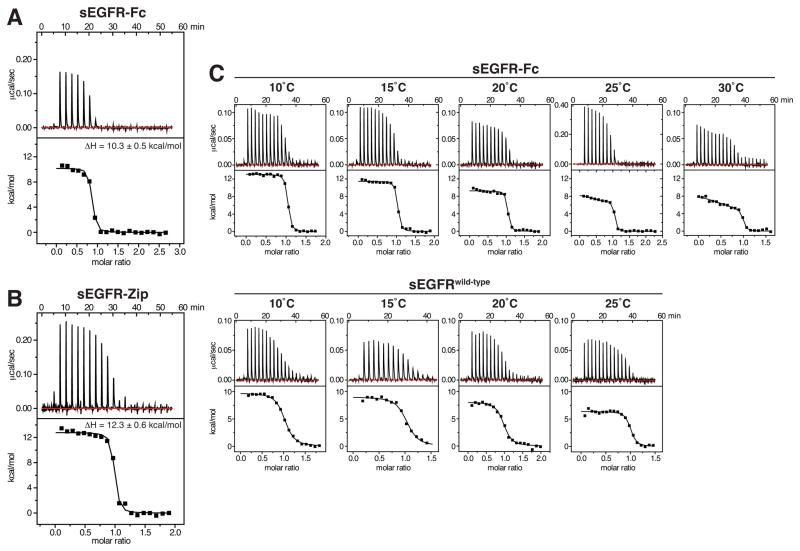
Figure 3. Evidence for heterogeneity of sites in forced sEGFR dimers.
(A) Representative ITC data for EGF binding to sEGFR-Fc at 25°C, with EGF at 130 μM in the syringe and sEGFR-Fc in the cell at 8.4 μM. (B) ITC data for EGF binding to sEGFR-Zip at 25°C, with EGF in the syringe at 105 μM and sEGFR-Zip in the cell at 11.3 μM. Mean ΔH values from three independent experiments (± SD) are listed. (C) ITC for EGF binding to sEGFR-Fc (upper) and sEGFRwild-type (lower) at the temperatures marked. EGF concentration in the calorimeter syringe was 80 μM, and sEGFR protein was present in the cell at 9 μM. Data for sEGFR-Fc at 25°C employed higher concentrations (25 μM sEGFR-Fc in the cell, 280 μM EGF in the syringe) to improve signal-to-noise in discerning distinct binding events.

