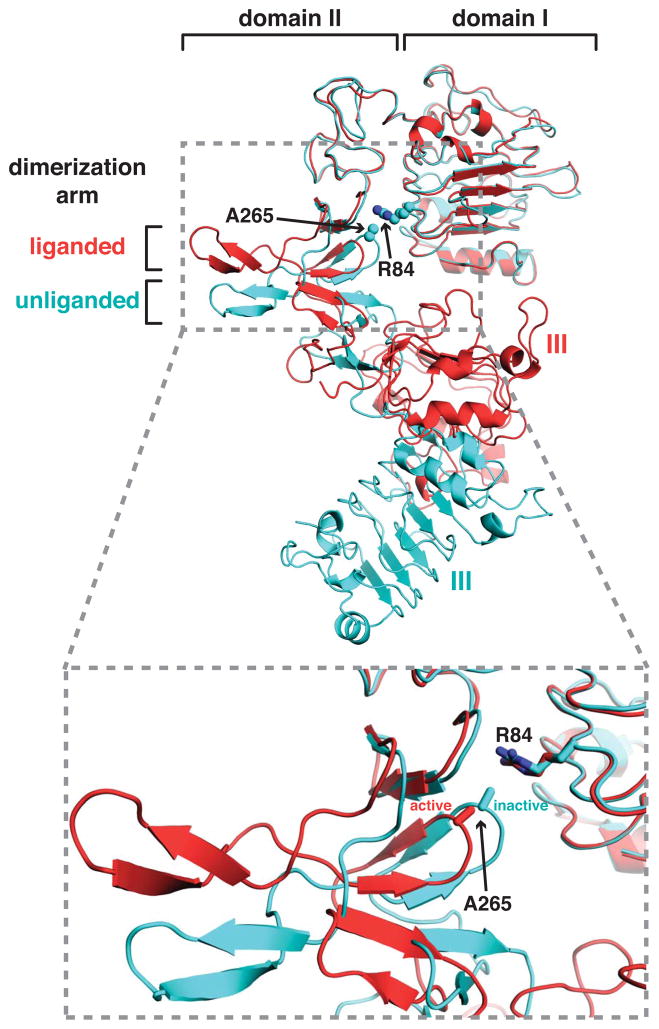
Figure 5. Location of EGFR domain I/II interface mutations in glioblastoma.
Cartoon representations of sEGFR crystal structures in liganded (red) and unliganded (cyan) states are shown, from PDB entries 1MOX (Garrett et al., 2002) and 1YY9 (Li et al., 2005), aligned using domain I as reference. Side-chains of R84 and A265 are shown, where the majority of mutations have been seen in glioblastoma (Lee et al., 2006; Vivanco et al., 2012) and where the domains I/II separation is increased upon activation (lower panel).

