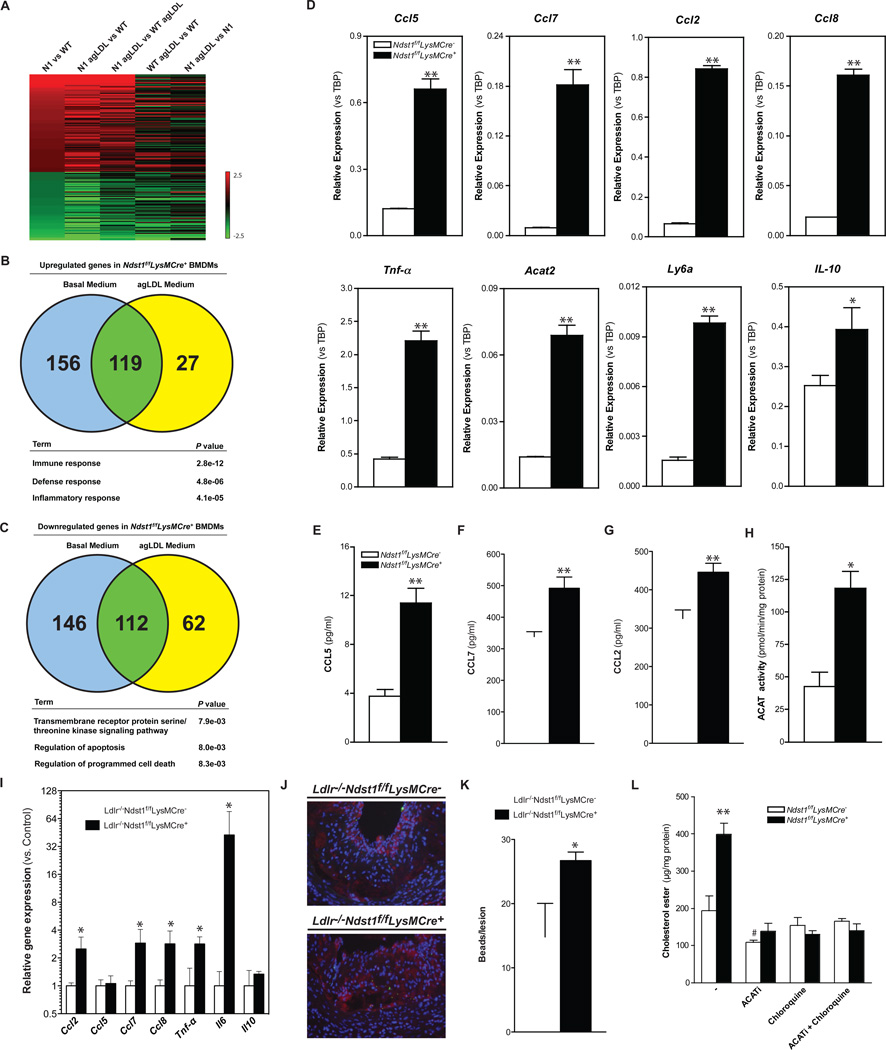
Figure 4. Reducing Macrophage HSPG Sulfation Increases Expression of Inflammatory Genes.
Microarray analysis on RNA isolated from BMDMs (n = 4/group). Gene expression was filtered for genes from untreated Ndst1f/fLysMCre+ BMDMs at least 2-fold different from WT control (A). Venn diagram of > 1.5x upregulated genes (B) and < 1.5x downregulated genes (C) and their overlap by agLDL treatment in the transcriptome of wild-type and Ndst1f/fLysMCre+ BMDMs, and p values for selected gene ontology (GO) terms. qPCR validation from WT and Ndst1f/fLysMCre+ BMDMs (D–F). Secretion of CCL5, CCL2 and CCL7 in the media by BMDMs after 24h at 37°C (E–G). ACAT activity levels in cell lysates from WT and Ndst1f/fLysMCre+ BMDMs (H). qPCR validation from atherosclerotic plaques isolated from Ldlr −/− Ndst1f/fLysMCre − and Ldlr −/− Ndst1f/fLysMCre + mice after 12-weeks HFC diet feeding.(n=3–4) (I). Micro-images and quantification of infiltrated fluorescent bead-labeled Ly6C high monocytes (green) in lesions of Ldlr −/− Ndst1f/fLysMCre + mice. Atherosclerotic lesions were stained for CD68 positive macrophages (red) and with DAPI for nuclei (blue) (n=3/group) (J–K). Cholesterol ester levels in BMDM after a 24h incubation with 50 µg/ml agLDL in the presence or absence of 10 µg/ml Sandoz 58–035 (ACATi), 30µM chloroquine or a combination (n = 3) (L). Shown are mean values ± SEM, *p<0.05 and **p<0.01.

