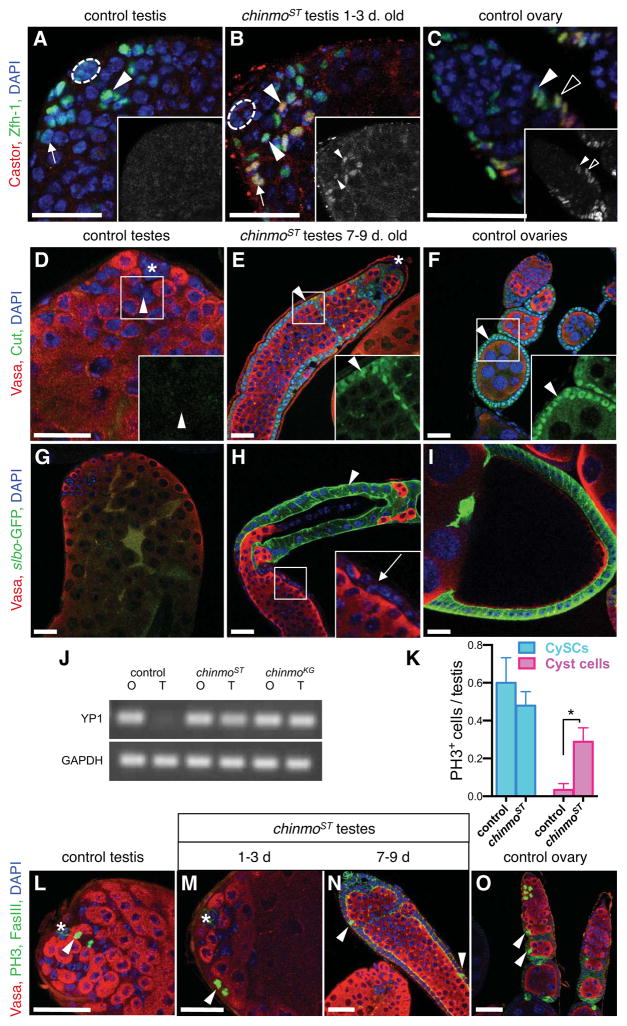
Figure 3. Reduction of Chinmo in adult testes causes somatic stem cells and their progeny to acquire female somatic markers.
(A–C) Immunofluorescence detection of Zfh-1 (green) and Castor (red) in testes and ovaries. Insets, red channel only shown in grayscale. In control testes (A), Zfh-1 marks CySCs (arrowhead) and early cyst cells (arrow), but Castor is not detected. In testes from young (1–3 day) chinmoST males (B), some CySCs (arrowheads) and cyst cells (arrow) express both Zfh-1 and Castor, as do ovarian follicle stem cells (solid arrowhead) and their early progeny (follicle cell progenitors, open arrowhead) in control ovaries (C). (D–F) Immunofluorescence detection of Cut (green) and Vasa (red). Insets, green channel only, magnified. In control testes (D), Cut is absent from all cells including CySCs (arrowhead), but it is present in follicle-like cells in chinmoST testes (E, arrowhead) and follicle cells in control ovaries (F, arrowhead). (G–I) Immunofluorescence detection of slbo-GFP (green). slbo-GFP is not expressed in control testes (G) but marks later somatic follicle cells (around stage 10) in control ovaries (I). In chinmoST testes (H), slbo-GFP marks a subset of follicle-like cells (arrowhead); adjacent follicle-like cells (inset, arrow) are not marked. (J) Yolk protein 1 (YP1) expression is detected by RT-PCR in ovaries (O) and testes (T) from 7–9 day chinmoST and chinmoKG adults but not from control adults. GAPDH is used as a control. (K) Bar graph showing the number of CySCs and cyst cells containing the mitotic marker phospho-histone H3 (PH3) in testes from 1–3 day old control or chinmoST flies. Somatic cells within 2 cell diameters of the hub were scored as CySCs; those more than 2 cell diameters away were scored as cyst cells. Significantly more mitotic cyst cells are found in chinmoST testes than in control testes (*, p=0.0168). There is no significant difference in the number of mitotic CySCs between chinmoST and control testes. Data represented as mean ± standard error of the mean. (L–O) Immunofluorescence detection of PH3 (green in nuclei). FasIII (green) marks cell membranes in the hub (asterisk, L–M), follicle-like cells (N), and follicle cells (O). In control testes (L), PH3 is detected in CySCs (arrowhead); cyst cells away from the hub are non-mitotic and do not express PH3. Cyst cells in young chinmoST testes (M) and follicle-like cells in older chinmoST testes (N) express PH3 (arrowheads), as do follicle cells (arrowheads) in control ovaries (O). Hubs marked by dashed line (A–B) or asterisk (D–E, L–M). DAPI marks nuclei (blue, all panels). Scale bars = 20 μm.

