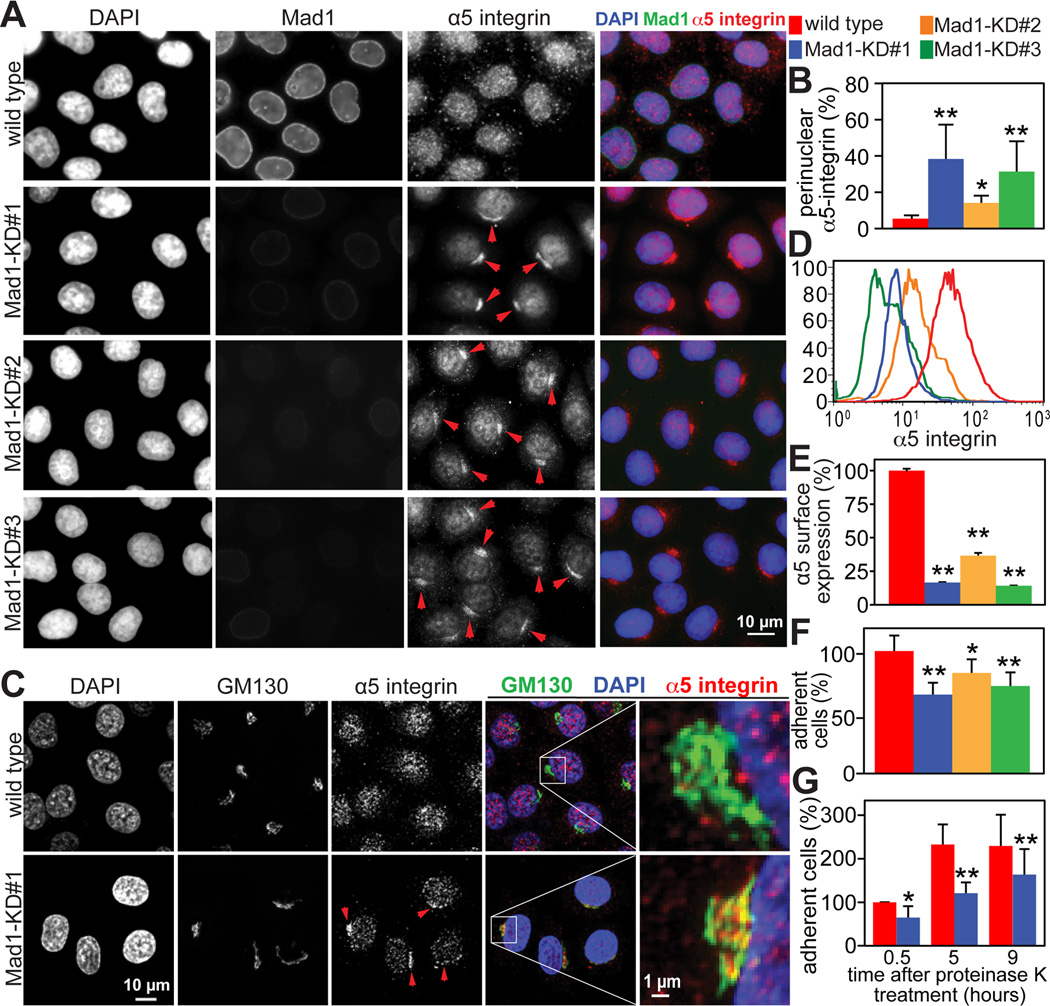
Figure 2. Golgi localized Mad1 participates in α5 integrin secretion and cell adhesion.
(A) Perinuclear accumulation of α5 integrin in Mad1-KD HeLa cell lines #1–3, indicated by arrowheads.
(B) Quantification +/− SD of perinuclear accumulation of α5 integrin, as depicted in A. n=200 cells from each of 3 independent experiments.
(C) Perinuclear α5 integrin in Mad1-KD#1 HeLa cells accumulates in the Golgi, shown by colocalization with GM130. Arrowheads indicate Golgi accumulation of α5 integrin. The boxed regions are enlarged in the far right panels.
(D) Flow cytometry analysis demonstrating that surface expression of an extracellular epitope of α5 integrin is reduced on Mad1-KD cell lines #1–3 as compared to wild type HeLa cells.
(E) Quantification +/− SD of flow cytometry measurements in D. n=10,000 events from each of 2 independent experiments.
(F) Reduced expression of Mad1 results in defective cellular attachment. Wild type and Mad1-KD HeLa cell lines #1–3 were plated on 5 µg/mL fibronectin and incubated at 37°C for 30 minutes before removing unattached cells. The average number of attached cells per 10× field +/− SD is shown. n=3.
(G) Mad1-mediated α5 integrin secretion promotes cell adhesion. Cell surface proteins were cleaved with 500 µg/mL proteinase K for 30 minutes on ice. After adding PMSF, cells were washed and permitted to recover at 37°C for the indicated amounts of time before plating 200,000 cells and allowing them to adhere to fibronectin coated dishes for 30 minutes. The average number of attached cells per 10x field +/− SD (normalized to the number of wild type cells at 0.5 hours) from 3 independent experiments is shown.
*=p<0.05. **=p<0.001.

