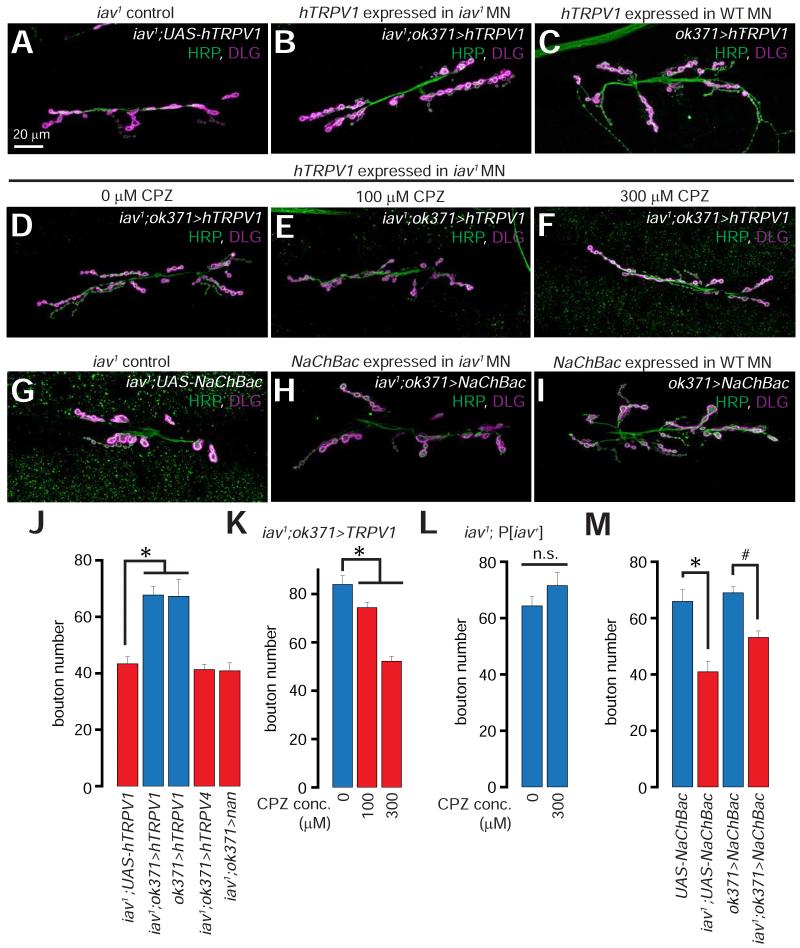
Figure 2. Suppression of iav1 synaptic growth defects by presynaptic expression of human TRPV1, but not human TRPV4.
(A-C) Confocal images of larval NMJs from larvae of the indicated genotypes stained with antibodies against HRP (green) and DLG (magenta).
(D-F) Confocal images of larval NMJs from larvae of the indicated genotypes that were fed the indicated concentrations of capsazepine (CPZ) stained with antibodies against HRP (green) and DLG (magenta).
(G-I) Confocal images of NMJs from larvae of the indicated genotypes stained with antibodies against HRP (green) and DLG (magenta).
Scale bar shown in (A) also applies to (B-I).
(J) Quantification of the NMJ bouton number in larvae of the indicated genotypes. *, p = 5.2×10⁻⁴, one-way ANOVA, n = 9-12 NMJs per genotype.
(K-L) Quantification of the NMJ bouton numbers in larvae of the indicated genotypes that were fed the indicated concentrations of CPZ. The overall increased baseline of the bouton number in all the genotypes here was a result of raising the flies on instant food. In (K), *, p = 10−9, one-way ANOVA, n = 14-28 NMJs per genotype. In (L), n.s. represents “not significant”, p = 0.22, unpaired Student’s t-test, n = 15 NMJs per genotype.
(M) Quantification of the NMJ bouton number in larvae of the indicated genotypes. *, p = 4.4×10⁻⁴, unpaired Student’s t-test, n = 8-9 NMJs per genotype; #, p = 1.3×10⁻⁵, unpaired Student’s t-test, n = 18-24 NMJs per genotype.
All values represent mean ±SEM. Abbreviations: WT, wild-type; MN, motor neuron; n.s., not significant.

