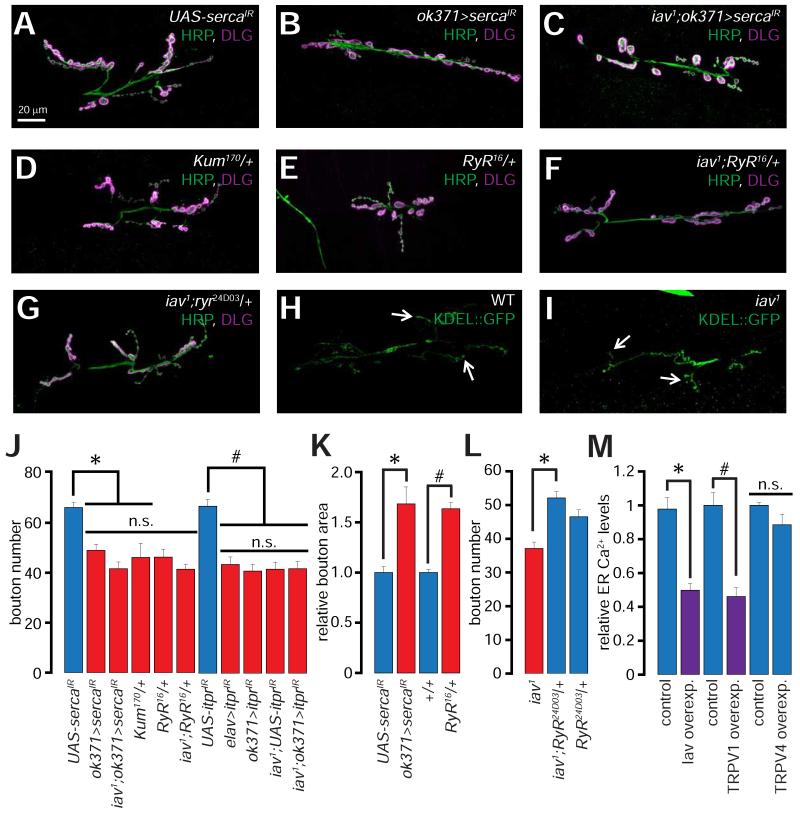
Figure 5. Role of ER Ca2+ release in NMJ synapse development.
(A-G) Confocal images of NMJs from larvae of the indicated genotypes stained with antibodies against HRP (green) and DLG (magenta).
(H-I) Confocal images of NMJs from larvae of the indicated genotypes expressing Lysozyme-KDEL::GFP (KDEL-GFP) stained with antibodies against GFP (green). Arrows point to distal boutons.
Scale bar shown in (A) also applies to (B-G).
(J) Quantification of the NMJ bouton numbers in larvae of the indicated genotypes. *, p = 5.5×10⁻⁹, one-way ANOVA (comparing the indicated data sets), n = 9-27 NMJs per genotype; #, p = 1.3×10⁻⁸, one-way ANOVA (comparing the indicated data sets), n = 13-14 NMJs per genotype.
(K) Quantification of the relative bouton area in larvae of the indicated genotypes. *, p = 6.4×10⁻⁴, unpaired Student’s t-test, n = 9-11 NMJs per genotype. #, p = 6.2×10⁻¹⁰, unpaired Student’s t-test, n = 14-16 NMJs per genotype.
(L) Quantification of the NMJ bouton numbers in larvae of the indicated genotypes. *, p = 3×10⁻⁶, unpaired Student’s t-test, n = 17-21 NMJs per genotype.
(M) Quantification of the relative ER Ca2+ levels as assessed by fura-2 imaging in control N2A cells and in N2A cells overexpressing (overexp.) the indicated TRPV channel. *, p = 3.4×10⁻¹⁰, unpaired Student’s t-test, n = 8-9 independent coverslips containing control or iav transfected cells (number of cells per field ≥8). #, p = 4×10⁻⁵, unpaired Student’s t-test, n = 8 independent coverslips containing control or TRPV1 transfected cells (number of cells per field ≥10).
All values represent mean ±SEM. Abbreviations: WT, wild-type; n.s., not significant.

