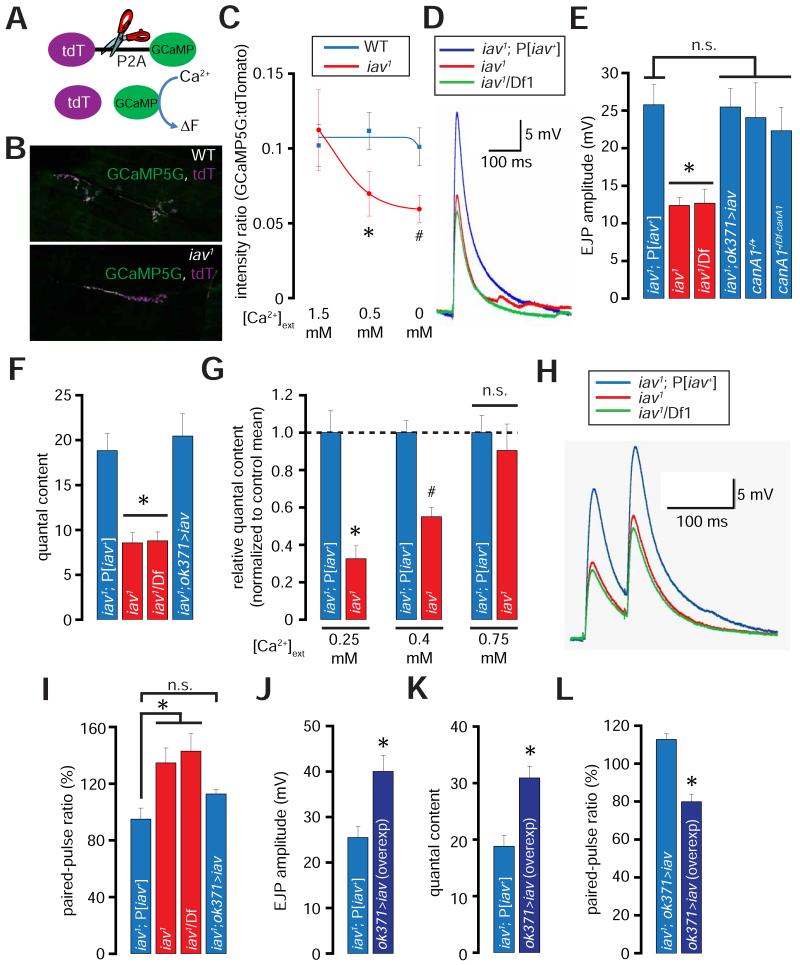
Figure 7. Diminished presynaptic resting Ca2+ levels and neurotransmission at the iav1 synapses.
(A) Structure of tdTomato-P2A-GCaMP5 (tdT-P2A-GCaMP). Cleavage at the P2A site (indicated by scissors) disengages the two fluorophores.
(B) Confocal images showing the expression of GCaMP5 and tdTomato (tdT) at the NMJ in larvae of the indicated genotypes.
(C) Quantification of the GCaMP5:tdTomato intensity ratios in wild-type (blue line) and iav1 (red line) at the indicated [Ca2+]ext. The blue and red curves were obtained by fitting the respective mean values to sigmoidal functions using Origin6 (OriginLab corporation). *, p = 0.04, unpaired Student’s t-test, n = 7-8 NMJs per genotype; #, p = 0.02, unpaired Student’s t-test, n = 7-8 NMJs per genotype.
(D) EJP traces obtained from recordings performed on larval NMJs of the indicated genotypes ([Ca2+]ext=0.5 mM).
(E) Quantification of the amplitude of the EJPs obtained from recordings performed on larvae of the indicated genotypes. *, p = 5.1×10⁻⁴, one-way ANOVA (comparing all the data sets shown), n = 6-8 NMJs per genotype.
(F) Quantification of the quantal contents obtained from recordings performed on larvae of the indicated genotypes. *, p = 1.1×10⁻⁵, one-way ANOVA (comparing all the data sets shown), n = 6-8 animals per genotype.
(G) Quantification of the relative quantal contents in iav1 normalized to the iav1; P[iav+] means at the indicated [Ca2+]ext. *, p = 3.5×10⁻⁴, unpaired Student’s t-test, n = 5-7 NMJs per genotype; #, p = 5.3×10⁻⁵, unpaired Student’s t-test, n = 7-10 NMJs per genotype.
(H) EJP trace obtained from paired-pulse recordings performed on larval NMJs of the indicated genotypes ([Ca2+]ext=0.5 mM).
(I) Quantification of the paired-pulse ratio (% change in the amplitude of the second EJP to that of the first EJP when the two were separated by duration of 50 ms) in the larvae of the indicated genotypes. *, p = 0.01, one-way ANOVA, n = 5-7 animals per genotype.
(J) Quantification of the EJP amplitudes in larvae of the indicated genotypes. *, p = 0.01, Student’s t-test, n = 6 NMJs per genotype.
(K) Quantification of the quantal content in larvae of the indicated genotypes. *, p = 0.002, unpaired Student’s t-test, n = 6 NMJs per genotype.
(L) Quantification of the paired-pulse ratio in larvae of the indicated genotypes. *, p = 1.5×10⁻⁴, unpaired Student’s t-test, n = 5-6 NMJs per genotype.
All values represent mean ±SEM. Abbreviations: WT, wild-type; n.s., not significant.

