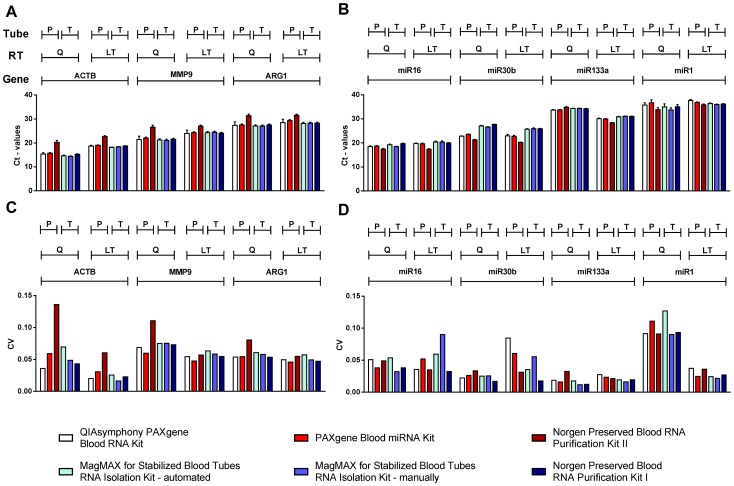
Figure 3. Analyses of absolute Ct-values and coefficients of variation of investigated mRNAs and miRNAs.
RNA from 12 probands, extracted with 6 RNA isolation kits from two collection tubes (PAXgene [P] and Tempus Blood RNA Tubes [T]) (n = 72) was reverse transcribed and analyzed by qRT-PCRs with reagents from Qiagen (Q) and Life Technologies (LT). Results of qRT-PCRs showing mean Ct-values (error bars indicate SEM) for (A) mRNA and (B) miRNA transcripts. (C,D) corresponding mean coefficients of variation (CV).

