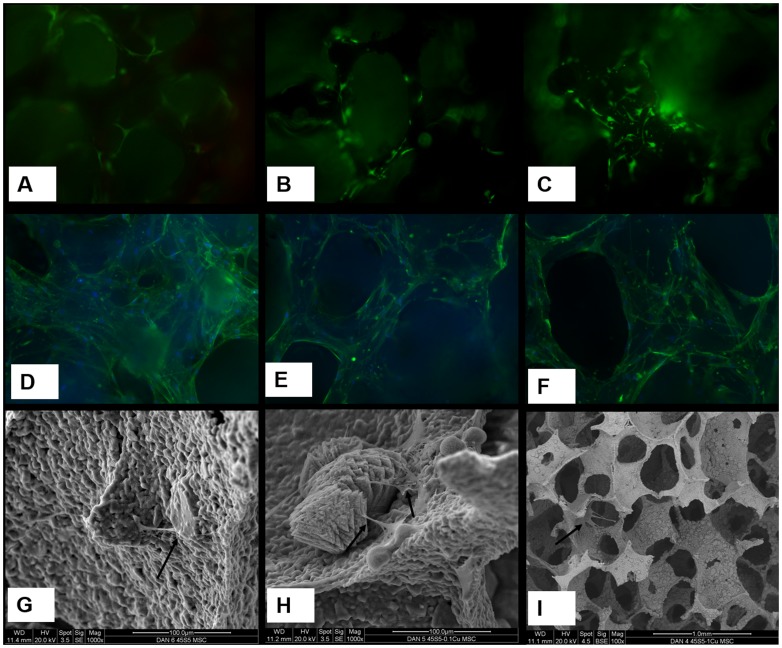
Figure 3. Fluorescent staining of live cells as green and dead cells as red (A, B, C) and the cyto-skeletal staining of actin showing the cell spreading (D, E, F), and scanning electron microscope pictures (G, H, I) for group A = only bioglass scaffolds (A, D, G), group B = scaffolds with 0.1% Cu2+ (B, E, H), and group C = scaffolds with 1% Cu2+ (C, F, I).
All samples are shown at week 4, though similar pictures were observed also at week 2. In SEM pictures, the cells are shown by arrows. Note the magnification is different in (I).

