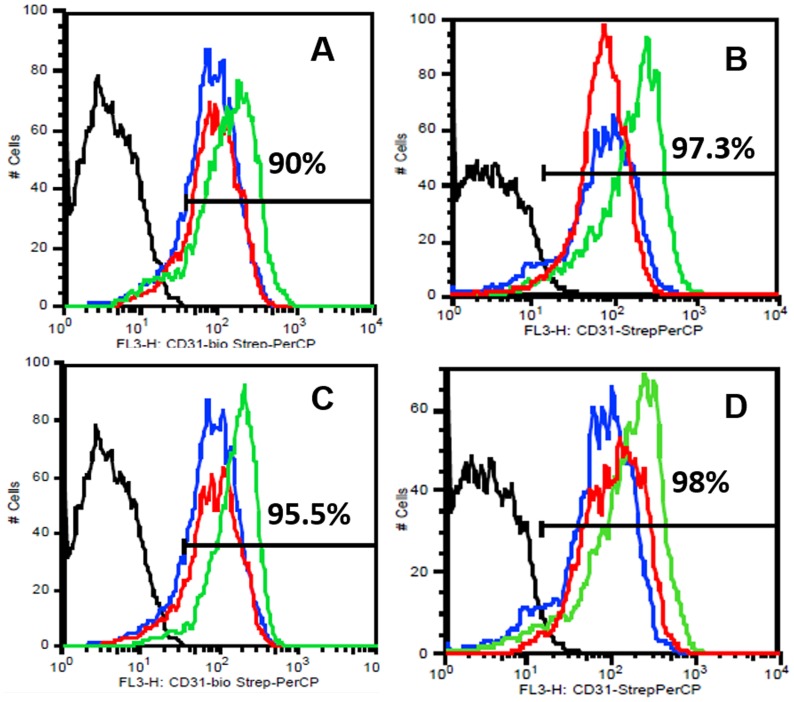
Figure 7. FACS analysis for CD 31 on the surface of HDMECs at week 1 (A,C) and week 2 (B, D).
The colors are depicted as black: negative control; blue: cells in cocktail media = group I; red: group II (A, B) or, group III (C, D); green: group IV (A, B) or, group V (C, D). The percentages of total cells positive for the dye in group IV (MSC-bioglass) are indicated in A and B; those in group V (MSC-Cu-bioglass) are in C and D.

