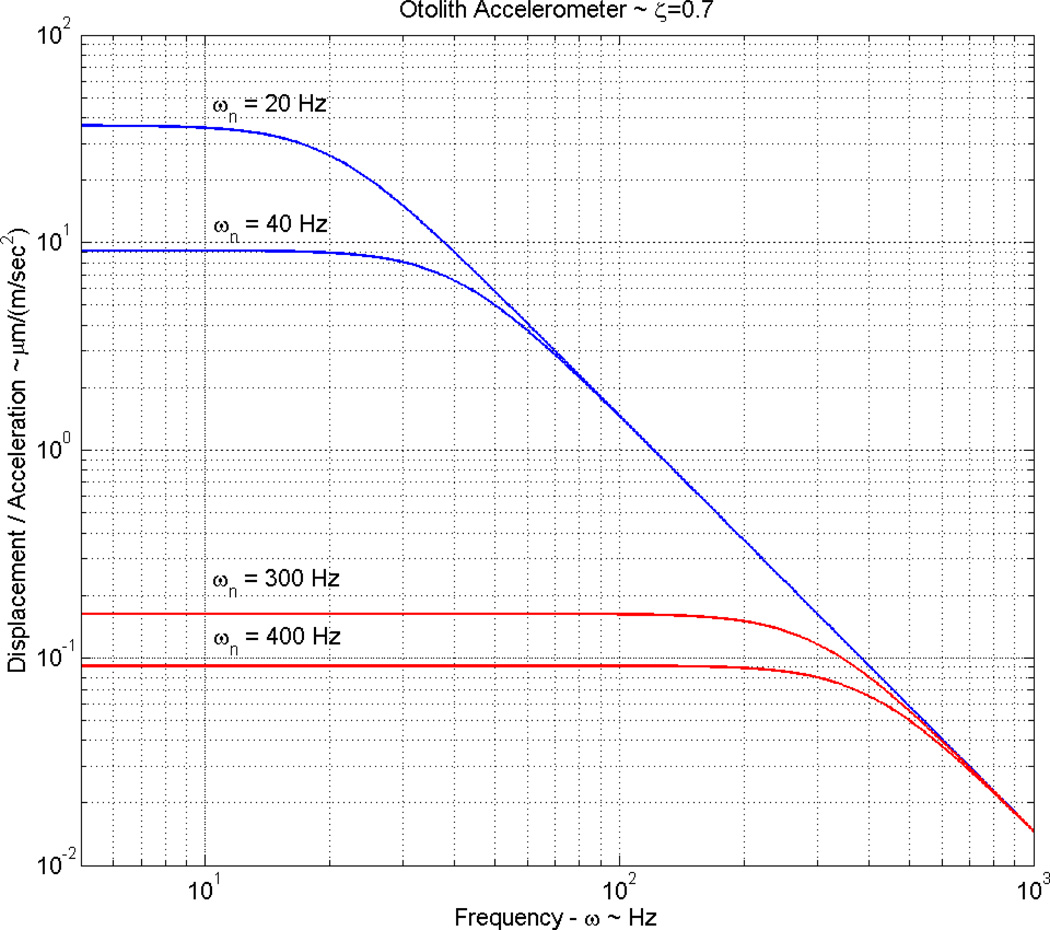
Figure 4. Gain magnitude vs frequency for a high mass saccule and low mass utricle.
Gain (OL Displacement/ Acceleration) versus system stimulus frequency plot, indicating the basic difference in gain or sensitivity of the high mass saccules and low mass utricles. The difference shown: (1) for high mass saccules with natural frequencies in the 20 to 40 Hz range (shown in blue), and (2) small mass utricles with natural frequencies in the 300 to 400 Hz range (shown in red). It is clear from this plot that the high mass saccules have large gain or sensitivities at the sacrifice of bandwidth. Low mass utricles gain an order of magnitude of bandwidth and loose two orders of magnitude in gain to achieve the bandwidth. The increased gain of high mass saccules is apparently tied to sensing earth born vibrations, while the bandwidth of utricles appears to be needed for visual fixation purposes (linear vestibular-ocular reflex) during rapid head motion.

