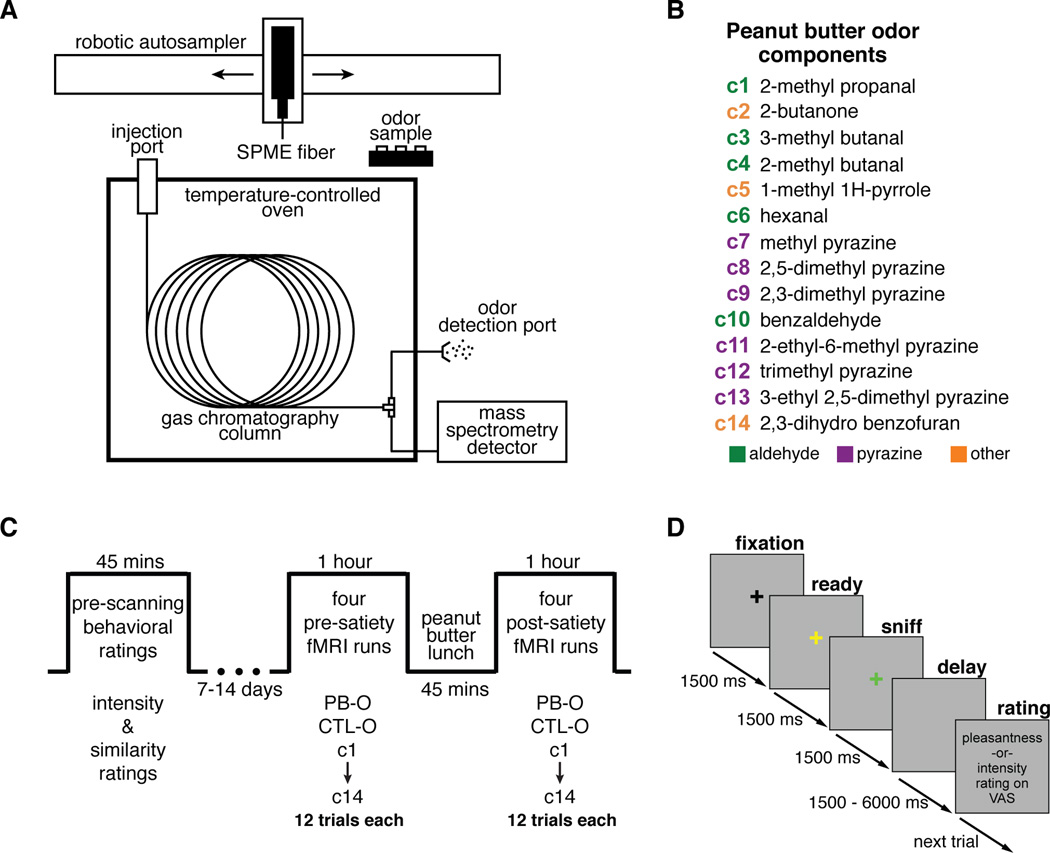
Figure 1. Peanut butter odor components and experimental design.
(A) Schematic of GC/MS equipment. The SPME fiber was exposed to the headspace of a peanut butter sample for 30 minutes before injection into GC column. (B) PB-O components identified by GC/MS analysis, listed in the order they came off the GC column, color coded by principal functional group. (C) Experimental timeline. In the pre-scanning phase, subjects rated the intensity of each of the 16 odor stimuli twice. These ratings were used to adjust odor concentrations in an attempt to minimize perceived intensity differences during the scanning session. Subjects also provided ratings of perceptual similarity between PB-O and each of its components in this phase. (D) Trial sequence. After a 1500ms “ready” cue, subjects were cued to sniff by presentation of a green crosshair during the 1500ms odor delivery. Then, after a variable delay, a rating prompt was shown.

