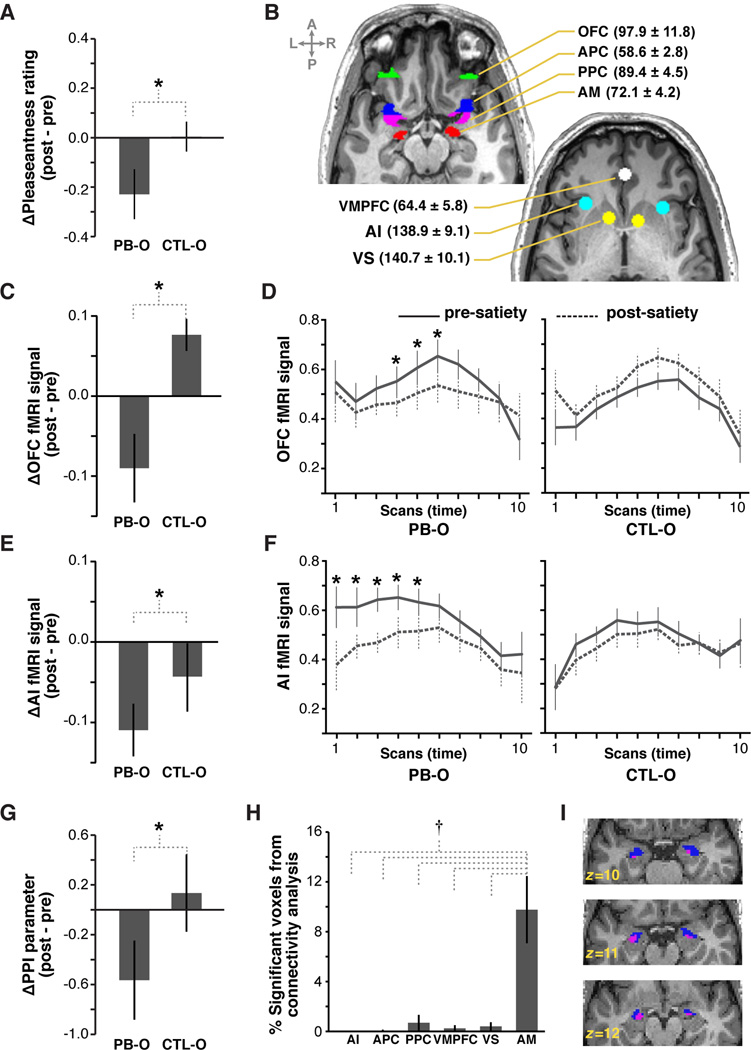
Figure 2. Sensory-specific satiety effects in relation to the whole odor.
(A) Change in pleasantness rating for PB-O and CTL-O from pre- to post-satiety. (B) Regions of interest from a representative subject overlaid on axial slices of a T1-weighted anatomical scan. Average numbers of voxels that passed the unbiased omnibus ANOVA (± s.e.m.) are in parentheses. (C) Satiety-related change in mean OFC activity. (D) Time course of OFC activity, starting from onset of odor delivery. One scan = 1.51s. (E,F) Satiety-related change in mean and fMRI time course of AI activity. (G) Change in functional connectivity strength between OFC and AM from pre- to post-satiety. (H) Percentage of voxels in tested ROIs showing significant sensoryspecific modulation of functional connectivity with OFC. (I) Cluster of voxels (pink) from three consecutive axial slices of a representative subject showing significant sensory-specific modulation of functional connectivity between OFC and AM (p < 0.05, repeated measures ANOVA), overlaid on the anatomical AM ROI (blue). All error bars represent across-subject standard error of the mean (s.e.m.). *p < 0.05, repeated measures ANOVA; †p < 0.05, post-hoc t-tests.

