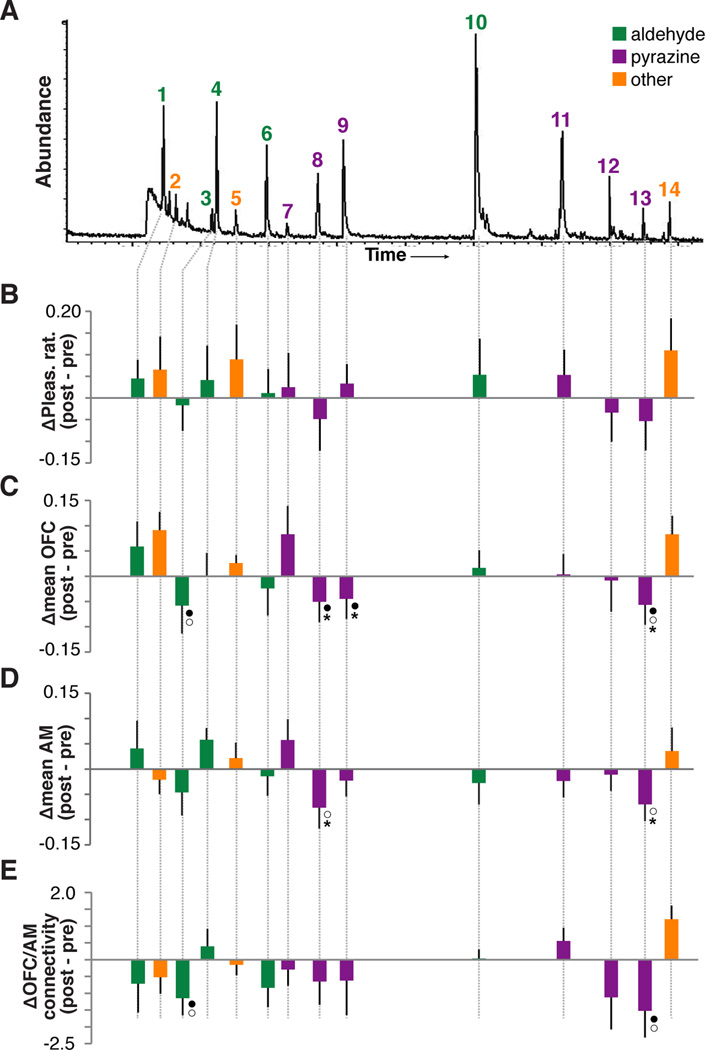
Figure 4. Satiety-related effects in response to the odorant components.
(A) Chromatograph obtained from one GC/MS analysis of a peanut butter odor sample. Each labeled peak indicates an identified PB-O component. Note that “abundance” on the y-axis does not reflect the relative concentration of each identified component in the mixture. See Fig.1B for chemical identities of the 14 components. (B–E) Satiety-induced changes in pleasantness (B), mean OFC activity (C), mean AM activity (D), and functional connectivity between OFC and AM (E) for each PB-O component. Error bares = across-subject s.e.m; ●p < 0.05, repeated measures ANOVA, condition-by-session interaction; ○p < 0.05 paired t-test, pre- vs. post-satiety; *corrected for false discovery rate (FDR) with q = 0.1.

