Fig. 1.
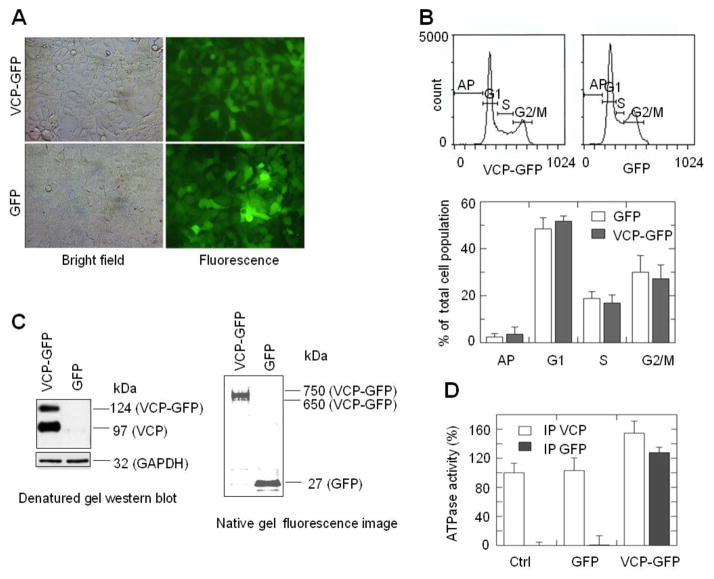
VCP-GFP retains biological properties of VCP. (A) HEK293 cells stably expressing VCP-GFP and GFP showed similar morphology in the bright field and green fluorescence images. (B) Cells expressing VCP-GFP and GFP exhibit similar cell cycle. Cells stained with propidium iodide were analyzed using flow cytometry. Cell cycle is presented as the means and standard errors (n=8, P > 0.05). (C) VCP-GFP forms a hexameric structure. VCP-GFP co-immunoprecipited with endogenous VCP (left panel). VCP-GFP protein complexes were immunoprecipitated using anti-GFP antibody followed by Western blotting with anti-VCP antibody. VCP-GFP and VCP were shown as a 124 kDa band (similar to the calculated molecular mass of VCP-GFP) and a 97 kDa band (the molecular mass of monomeric VCP). GAPDH was probed as a loading control. The native gel fluorescence imaging of VCP-GFP showed that VCP-GFP is in a hexameric structure (right panel). The lysates of HEK293 cells expressing VCP-GFP or GFP were resolved using 3–16% native gel. The gel image was taken using a Fluoro Image Analyzer. The 650 to 750 kDa and 27 kDa bands were shown as VCP-GFP and GFP, respectively. (D) VCP-GFP retains the ATPase activity. Protein complexes were immunoprecipitated using anti-GFP or anti-VCP antibody from the lysates of HEK293 cells without transfection (Ctrl) or transfected with GFP or VCP-GFP. The ATPase activities of the immunoprecipited protein complexes were analyzed using a colorimetric ATPase assay. The ATPase activity was shown as the percentage of the ATPase activity of immunoprecipitated protein complexes in the control sample. Data are presented as mean and standard error of four experiments.

