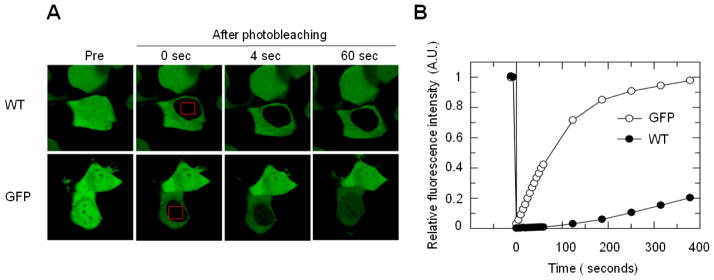
Fig. 3.

FRAP analysis of the nuclear entry of VCP–GFP in HEK293 cells. (A) The nucleus of the cells expressing VCP–GFP or GFP were photobleached for 4 s (area indicated by red boxes), and the fluorescence images were obtained at 4 s intervals over 400 s by confocal microscopy. (B) Quantitative analysis from results in (A) for the fluorescence recovery in the nucleus using single exponential FRAP of MIPAV software, where differences in fluorescence recovery rate were observed between VCP-GFP and GFP.
