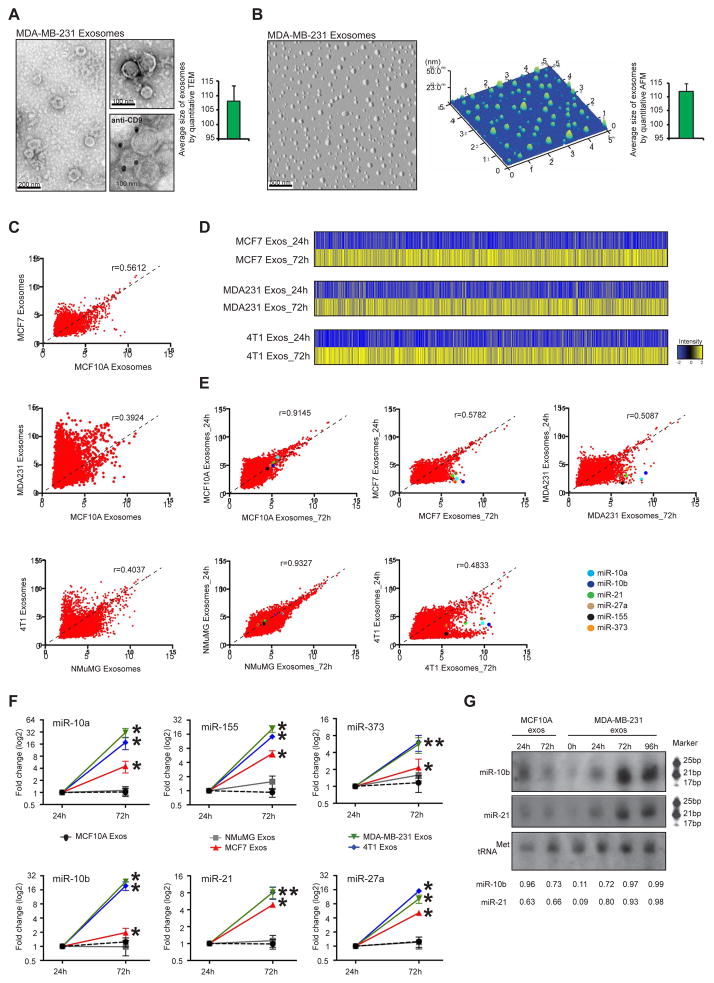
Figure 1. Cancer exosomes become enriched in miRNAs.
(A) Transmission electron micrograph of MDA-MB-231 exosomes. Lower right image produced by immunogold of CD9 and TEM of MDA-MB-231 exosomes. Gold particles are depicted as black dots. Graph represents the average size of exosomes analyzed from 112 TEM pictures. (B) AFM image of MDA-MB-231 exosomes. Middle graph represents dispersion of particles in the coverslip with size range of exosomes. Right graph represents average size of exosomes analyzed from 26 AFM pictures. (C) Scattterplots of miRNAs expression assessed by miRNA array, in MCF-7, MCF10A, MDA-MB-231, 4T1 and NMuMG exosomes. Pearson correlation coefficient, r, is used as a measure of the strength of the linear relationship between 2 exosomes samples. (D) HeatMaps of miRNAs expression array of cancer exosomes cultured for 24 and 72 hr (MCF-7 exosomes cultured for 24 hr versus MCF-7 exosomes cultured for 72 hr; MDA-MB-231 exosomes cultured for 24 hr versus MDA-MB-231 exosomes cultured for 72 hr; and 4T1 exosomes cultured for 24 hr versus 4T1 exosomes culture for 72 hr) (see Extended Experimental Procedures). (E) Scattterplots of miRNAs expression assessed by miRNA array, in exosomes cultured for 24 versus 72 hr of MCF10A, MCF-7, MDA-MB-231, NMuMG and 4T1 cells. Pearson correlation coefficient, r, is used as a measure of the strength of the linear relationship between the two exosomes samples. miR-10a, miR-10b, miR-21, miR-27b, miR-155 and miR-373 are color-coded and identified in the scatterplots. (F) MCF10A, NMuMG, MCF7, MDA-MB-231 and 4T1 exosomes were resuspended in DMEM media FBS-depleted and maintained in cell-free culture for 24 and 72 hr. After 24 and 72 hr, exosomes were recovered and 6 miRNAs were quantified by qPCR. The fold-change of each miRNA in exosomes after 72 hr cell-free culture was quantified relative to the same miRNA in exosomes after 24 hr cell-free culture. The plots represent the fold-change for the miRNAs in exosomes harvested after 72 hr compared to those harvested after 24 hr. (G) Northern blots of miR-10b and miR-21 from normosomes after 24 and 72 hr of cell-free culture and cancer exosomes without culture and with 24, 72 and 96 hr of cell-free culture. The tRNAMet was used as a loading control. Quantification was done using Image J software.
qPCR data represented are the result of 3 independent experiments each with 3 replicates and are represented as ± SEM. Significance was determined using t tests (*p<0.05). See also Figure S1, Tables S1–6.

