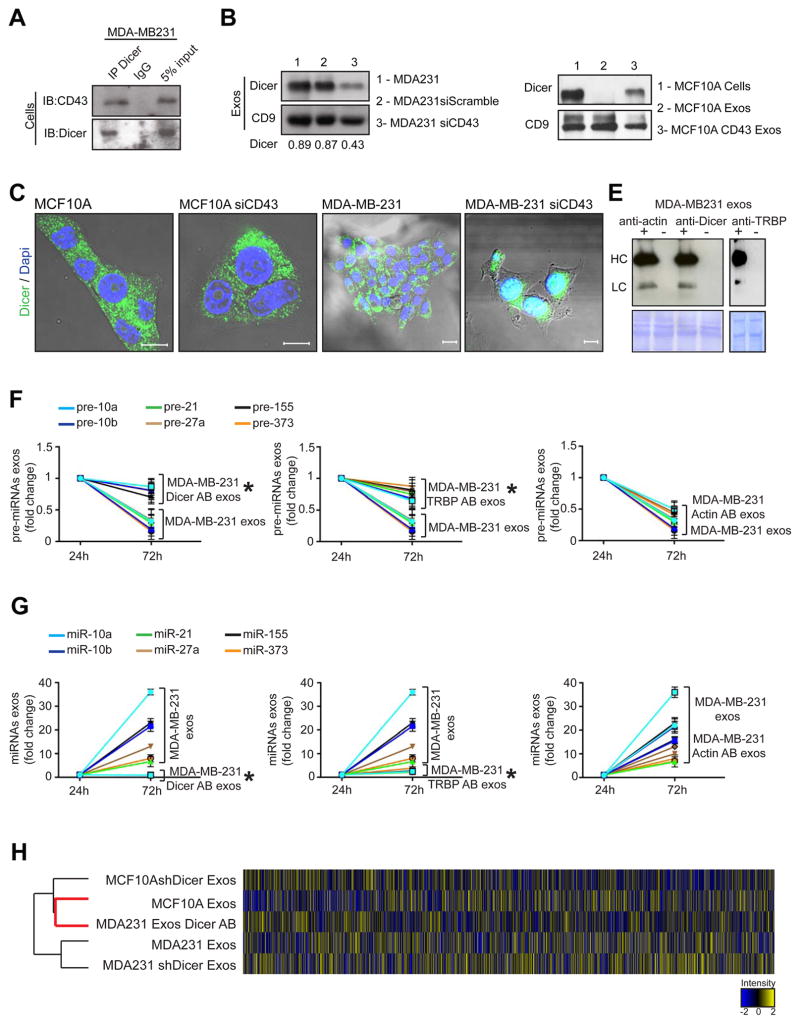
Figure 4. Cancer exosomes process pre-miRNAs to generate mature miRNAs.
(A) Immunoblot for CD43 and Dicer in MDA-MB-231 cell lysates immunoprecipitated with Dicer antibody and IgG. (B) Immunoblot of Dicer in MDA-MB-231siCD43 exosomes. CD9 was used as a loading control and quantification achieved by Image J software. (C) Dicer expression in MCF10A and MDA-MB-231 cells (first and third panels) compared to MCF10A and MDA-MB231siCD43 cells (second and fourth panels). Scale bars 20 μm (two left images) and 10 μm (two right images). (D) Immunoblot of Dicer in MCF10A exosomes (2), exosomes derived from MCF10A cells overexpressing CD43 (3) and MCF10A cells (1). CD9 was used as a loading control. (E) Immunoblot using anti-rabbit and anti-mouse secondary antibody to detect heavy chain (HC) and light chain (LC) primary Dicer, Actin or TRBP antibodies electroporated in exosomes of MDA-MB231 cells. Electroporated exosomes without antibody derived from MDA-MB231 cells were used as negative control. Proteinase K treatments were performed after electroporation. (F) MDA-MB-231 exosomes were harvested in quadruplicate. Samples were electroporated with anti-Dicer, anti-actin, or anti-TRBP antibodies. The 3 samples plus control were left in cell-free culture conditions (FBS-depleted) for 24 and 72 hr. After 24 and 72 hr exosomes were extracted and the 6 pre-miRNAs were quantified by qPCR. The fold-change of each pre-miRNA in exosomes after 72 hr cell-free culture was quantified relative to the same pre-miRNA in exosomes after 24 hr cell-free culture in each sample. The graphical plots represent the fold change of the 6 pre-miRNAs. (G) MDA-MB-231 exosomes were harvested in quadruplicate. Samples were electroporated with anti-Dicer, anti-actin, or anti-TRBP antibodies. The 3 samples plus control were left in cell-free culture conditions (FBS-depleted) for 24 and 72 hr. After 24 and 72 hr exosomes were extracted once again and the 6 miRNAs were quantified by qPCR. The fold-change of each miRNA in exosomes after 72 hr cell-free culture was quantified relative to the same miRNA in exosomes after 24 hr cell-free culture in each sample. The graphical plots are a representation of the fold change of the six miRNAs. (H) HeatMap of miRNAs array MDA-MB-231 exos, exosomes electroporated with Dicer Antibody (MDA231 exos Dicer AB), MCF10A exosomes, MDA-MB-231 shDicer Exosomes and MCF10AshDicer Exosomes. An average of duplicates is represented for each sample.
The qPCR data are the result of 3 independent experiments each with 3 replicates and are represented as ± SEM; significance was determined using t tests (*p<0.05). See also Figure S4 and Table S7.

