
Figure 3. Integration methods for multiple data types or datasets.
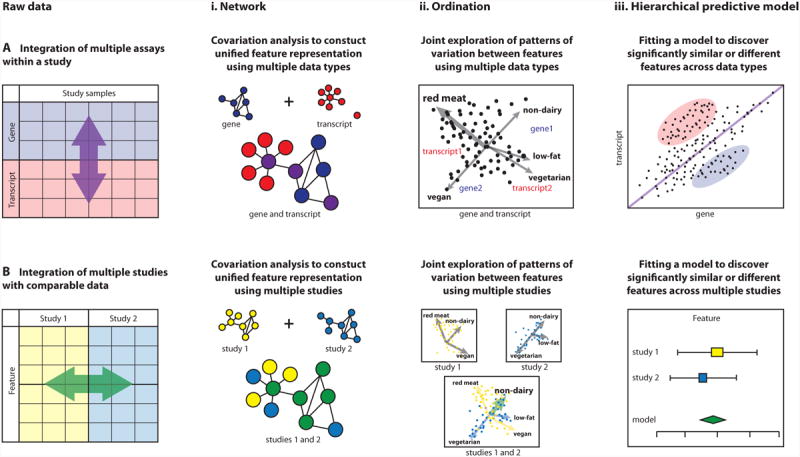
Schematic of approaches for data integration either (A) among different data types within the same study or (B) across different studies assaying the same data type. Integration methods include (i) network analyses capturing similarity of genes/gene products/microbes (correlation, co-abundance, co-expression, etc); (ii) ordination projections, showing overall patterns of clustering or co-variation (shown here applying to samples, can also apply to gene/microbial features); and (iii) hierarchical statistical models such as regression that quantify the degree of association among genes/microbes and sample phenotypes. Each of these methods can be applied to one or more assay types (and phenotype metadata) within study, or they can be applied to a combination of multiple studies. (Ai) Networks of covarying features can be generated separately for different data types (e.g. gene and transcript) or using both data types in one unified network by correlating multiple feature types. (Bi) Networks of covarying features can also be generated separately for different studies or can be summarized in one network to relate features that covary in both studies. (Aii) A combined ordination (or biplot) of multiple data types (e.g. gene and transcript) can reveal patterns of variation that enrich one or more data types or metadata (e.g. red meat consumption) in particular subsets of samples. In this example, samples are ordinated jointly with metadata, genes, and transcripts. (Bii) Ordination can be used to understand patterns of variation either independently in different studies, or a joint ordination can reveal patterns of sample co-variation across studies, possibly as linked to common metadata (e.g. consumption of non-dairy diet). (Aiii) Statistically significantly (un)related features can be identified by formal models such as linear regression. Regression among linked data types (e.g. genes and transcripts) can quantify the degree to which features or metadata associate across data types. In this example, we show feature levels that are similar between data types (close to the diagonal) as well as those that are significantly up- or down-regulated. (Biii) Statistical models can be meta-analyzed by applying them within each study, determining the significance and variability of a result within each study individually, and then comparing the resulting significance and effect sizes across studies. Meta-analysis can be used to detect signals too weak to see in any one study or to assess the reproducibility of a result across studies.