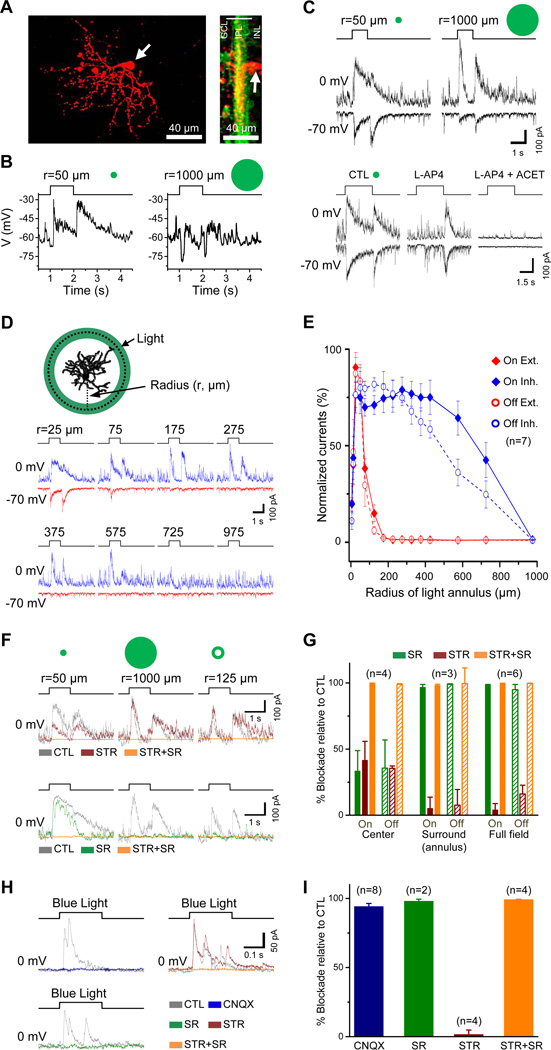
Figure 3. Receptive-field properties of GACs.
(A) Whole-mount (left) and cross-sectional (right) views of a GAC (red) after whole-cell recording in a vGluT3Cre/ChR2-YFP (green) mouse retina. White arrows, GAC soma. (B) Responses of a GAC to 1-s-long flashes of light spots under current clamp, showing depolarizing ON-OFF responses to a small spot (50 µm in radius, left) and hyperpolarizing ON-OFF responses to a large spot (1000 µm in radius, right). (C) Upper: responses of another GAC under voltage clamp to 1-s light flashes of two different sizes (50 and 1000 µm in radius, centered on the soma), showing inward ON-OFF EPSC (at −70 mV) and outward ON-OFF IPSC (at 0 mV). Lower: responses of the same GAC to 3-s flashes of a 50-µm-radius light spot, showing selective blockade of ON responses by L-AP4 and of both ON and OFF responses by L-AP4 and ACET. (D) Responses of a GAC to 1-s flashes of light annuli (50 µm in thickness), showing EPSCs (red, −70 mV) and IPSCs (blue, 0 mV) evoked by light annuli of various radii. (E) Normalized peak EPSCs and IPSCs as a function of annulus radius (n=7 GACs). Thickness of the annuli was 50 µm, except the smallest two annuli, which were 10 and 25 µm, respectively. (F) Effects of STR and SR (applied in two different sequences) on IPSCs evoked by a center light spot (50 µm in radius, left), a full-field light spot (1000 µm in radius, center), and a surround light annulus (125 µm in radius, right). (G) Summary of effects of SR and STR on ON-OFF IPSCs evoked by center, surround, and full-field light spot shown in (F). (H) Effects of CNQX, SR, and STR on inhibitory currents (at 0 mV) evoked by blue light stimulation of ChR2-expressing GACs in the presence of L-AP4, ACET, HEX, and atropine. (I) Summary of effects in (H), indicating that blue light evoked glutamate release from GACs onto unidentified amacrine cells, which, in turn, were induced to release GABA onto GACs. Numbers in parentheses, cells tested. Error bars, SEM. Drug concentrations (µM): ACET, 10; atropine, 2; CNQX, 40; HEX, 300; L-AP4, 20; SR, 50; STR, 2. See also Figure S3.

