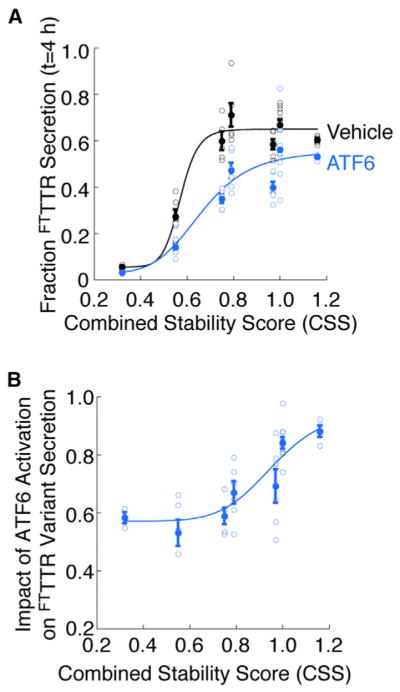
Figure 2. The ATF6-Dependent Decrease in Destabilized TTR Variant Secretion Correlates with the Energetic Stability of the TTR Tetramer.

(A) Plot relating the TTR variant CSS as calculated in (Sekijima et al., 2005) (Table S1) to the fraction FTTTR variant secreted at 4 hr in the absence (black) or presence (blue) of ATF6 preactivation. The solid circles show the average for all replicates and the open circles show all individual replicates. The error bars show SEM for n ≥ 3. The curves describe the least-squares fit of the individual replicates to the sigmoid function (defined in Experimental Procedures).
(B) Plot relating the TTR variant CSS as calculated in (Sekijima et al., 2005) (Table S1) to the impact of ATF6 activation on FTTTR variant secretion. The impact of ATF6 activation on FTTTR variant secretion is defined as {fraction FTTTR secretion at 4 hr in the presence of ATF6 preactivation} divided by {fraction FTTTR secretion at 4 hr in the absence of ATF6 preactivation}. The solid circles show the average impact of ATF6 activation for all replicates and the open circles show all individual replicates. The error bars show SEM for n ≥ 3. The line describes the least-squares fit of the individual replicate data to the sigmoid function defined in Experimental Procedures.
