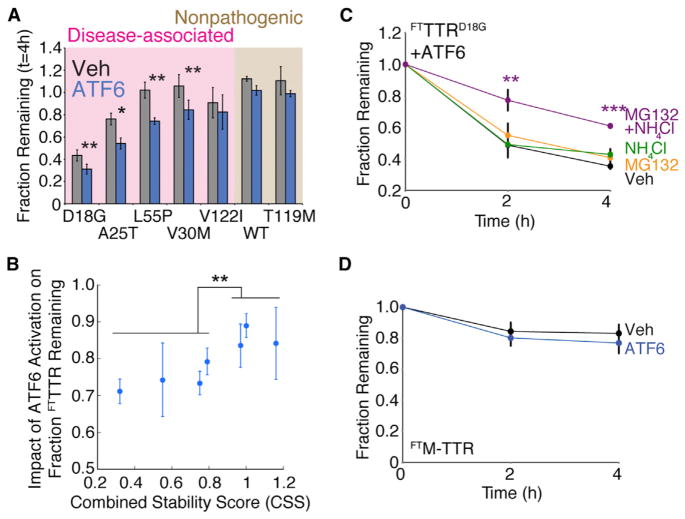
Figure 3. Stress-Independent ATF6 Pre-activation Increases Partitioning of Destabilized TTR Monomers to ER Degradation Pathways.
(A) Bar graph comparing the fraction remaining of [35S]-labeled FTTTR variants at 4 hr in the absence (gray) or presence (blue) of ATF6 preactivation. Fraction remaining was calculated from autoradiograms as shown in Figure S1A, using the equation: Fraction Remaining = {Total FTTTR Signal in Lysate at Time = t } + {Total FTTTR Signal in Media at Time = t } divided by {Total FTTTR Signal in Lysate at Time = 0 } + {Total FTTTR Signal in Media at Time = 0 } (Sekijima et al., 2005; Shoulders et al., 2013). Shading shows familial disease-associated FTTTR variants (pink) and FTTTR variants not involved in familial disease (brown). Error bars represent SEM from biological replicates (n ≥ 3).
(B) Plot relating the impact of ATF6 activation on the fraction remaining for FTTTR variants, as shown in Figure 3A, to each respective TTR variants’ CSS (Table S1). The impact of ATF6 activation on FTTTR variant fraction remaining is defined as {fraction FTTTR remaining t = 4 hr in the presence of ATF6} divided by {fraction FTTTR remaining t = 4 hr in the absence of ATF6}. Error bars represent SEM from biological replicates (n ≥ 3).
(C) Quantification of fraction remaining for [35S]-labeled FTTTRD18G in HEK293DAX following ATF6 preactivation (10 μM TMP; 16 hr) when chased in the presence of vehicle (black), MG132 (10 μM; orange), NH4Cl (25 mM; green), or both MG132 and NH4Cl (purple). A representative autoradiogram and experimental protocol employed are shown in Figure S2A. Error bars represent SEM from biological replicates (n ≥ 3).
(D) Quantification of fraction remaining of [35S]-labeled FTM-TTR in HEK293DAX in the absence (black) or presence (blue) of ATF6 preactivation (10 μM TMP; 16 hr). A representative autoradiogram is shown in Figure S2D. Error bars represent SEM from biological replicates (n = 6).
*p < 0.05, **p < 0.01, ***p < 0.001.

