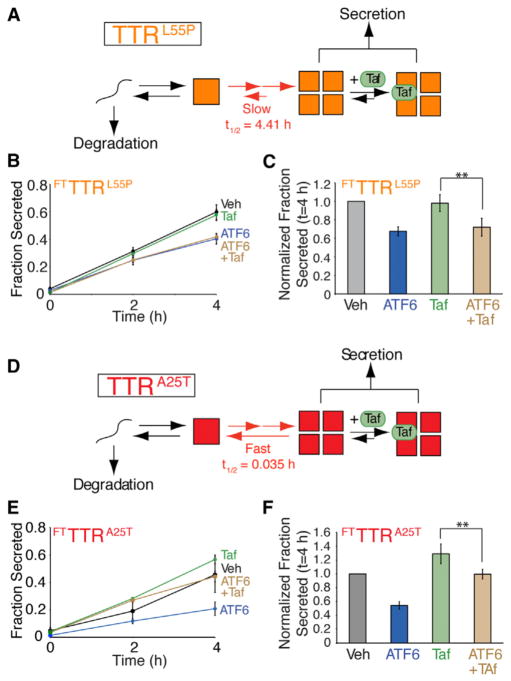
Figure 5. ATF6 Preactivation Decreases Secretion of Destabilized FTTTR Variants in the Presence of the Small Molecule TTR Tetramer Kinetic Stabilizer Tafamidis.
(A) Illustration showing the folding, assembly, secretion, and Taf binding for TTRL55P in the ER lumen. Note that the rate of TTRL55P tetramer dissociation is slow relative to the rate of secretion, indicating that the effect of Taf binding on the ER population of TTR tetramers will be negligible.
(B) Plot showing fraction FTTTRL55P secretion from HEK293DAX cells in the absence of ATF6 preactivation (black), the presence of ATF6 preactivation (10 μM TMP; 16 hr; blue), in the presence of Taf included in the pretreatment and the chase media (10 μM 16 hr; green), or in the presence of ATF6 pre-activation where Taf was added during the preincubation and the chase media (brown). A representative autoradiogram and the experimental protocol employed are shown in Figure S4A. Error bars represent SEM from biological replicates (n = 6).
(C) Bar graph depicting the normalized fraction secreted for FTTTRL55P at 4 hr as shown in Figure 5B. Error bars represent SEM from biological replicates (n = 6).
(D) Illustration showing the folding, assembly, secretion, and Taf binding for TTRA25T in the ER lumen. Note that the rate of TTRA25T tetramer dissociation is fast relative to the rate of secretion, indicating that Taf can bind to and stabilize TTRA25T tetramers in the ER lumen increasing TTRA25T secretion.
(E) Plot showing fraction FTTTRA25T secretion from HEK293DAX cells in the absence of ATF6 preactivation (black), the presence of ATF6 preactivation (10 μM TMP; 16 hr; blue), in the presence of Taf included in the pretreatment and the chase media (10 μM 16 hr; green), or in the presence of ATF6 pre-activation where Taf was added during the preincubation and the chase media (brown). Error bars represent SEM from biological replicates (n = 3).
(F) Bar graph depicting the normalized fraction secreted for FTTTRA25T at 4 hr as shown in Figure 5E. Error bars represent SE from biological replicates (n = 3).
**p < 0.01.

