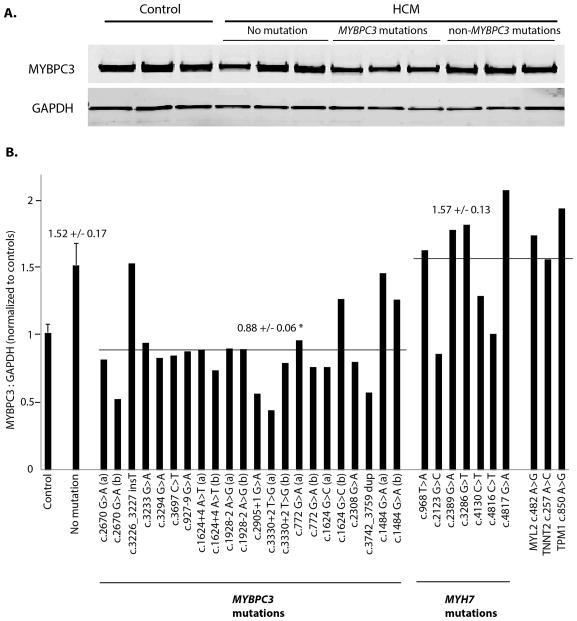
Figure 2.
MYBPC3 protein level. A. Representative western blot and B. Graph summary of densitometric analysis for MYBPC3 protein normalized to GAPDH and expressed as a % of the average of controls run on each gel. Results are shown for control, non-failing hearts (N=10), and HCM hearts without sarcomere mutations (N=14), with MYBPC3 mutations (N=22), and with sarcomere mutations other than MYBPC3 (N=10). *P<0.001 for HCM with MYBPC3 mutations vs HCM with or without other sarcomere mutations, †P<0.05 for HCM without sarcomere mutations vs controls and for HCM with non-MYBPC3 sarcomere mutations vs controls.

