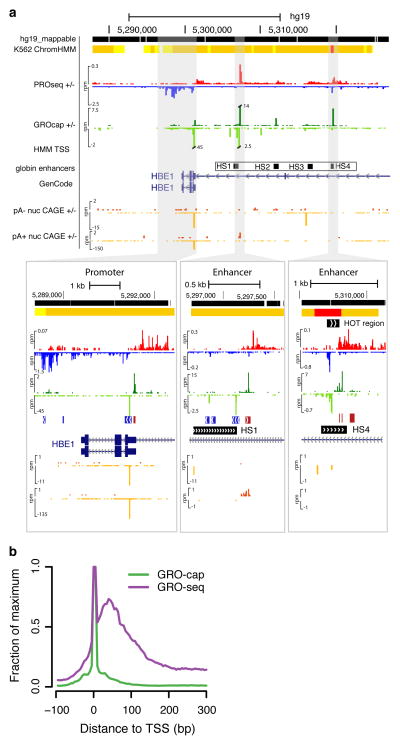
Figure 1. GRO-cap identifies TSSs in promoters and enhancers.
(a) A UCSC genome browser54 shot of the globin locus near the LCR using K562 cell line data sets generated or used in this study. The locus contains a portion of the beta-globin locus, including the globin epsilon gene and LCR enhancers. The insets are zoomed in views of the shaded regions that show the divergent GRO-cap (+ strand: dark green, − strand: light green) signal at the epsilon-globin promoter (left) and two enhancers associated with the hypersensitive site (HS) 1 (center) and HS4 (right). The locations of the HS sites are taken from probe locations in Ashe et al. 55. ChromHMM regions track is shown on top, with predicted promoters indicated in red and enhancers in orange. Note that CAGE signal (+ strand: dark orange, - strand: light orange) is at background levels in the enhancer region. (b) GRO-cap dramatically enriches the signal for initiation sites when compared with GRO-seq. Composite GRO-seq and GRO-cap reads from the cell line plotted relative to all GENCODE TSSs.

