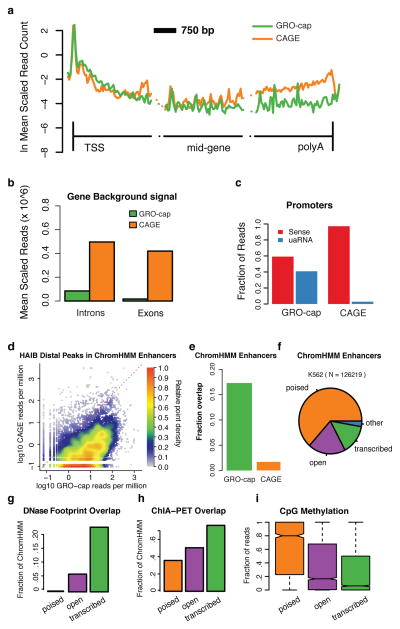
Figure 2. Comparison of GRO-cap with CAGE.
(a) GRO-cap and CAGE profiles at protein-coding genes. Genes are broken into three 3 Kb regions covering region around the TSS, the middle of the gene, and near 3′-cleavage/poly-A site. The vertical lines represent the TSS and 3′-cleavage site. (b) Average read density in interior introns and exons (excluding the first and last of each) as a measure of GRO-cap and CAGE background signals. (c) GRO-cap and CAGE relative fraction of reads aligned to sense and divergent (uaRNA) directions at protein-coding genes (counted within underlying ChromHMM region). (d) Density scatterplot showing the signal intensity (reads per million) for GRO-cap vs. CAGE surrounding distal transcription factor ChIP-seq peaks from the Hudson Alpha Institute for Biotechnology (HAIB). (e) Fraction of ChromHMM regions containing a detectable GRO-cap (green) or CAGE (orange) TSS. (f) Comparing enhancer regions based on chromatin marks (ChromHMM Enhancers, Ernst. et al. 28) with DNAse HS (OpenChrommatin consortium) and GRO-cap, reveals three main classes of enhancer regions, poised (no DNAse HS peak nor GRO-cap TSS; orange, n = 1624), open (DNAse HS peak, but no GRO-cap TSS; purple; n= 3740) and transcribed (DNAse HS peak and GRO-cap TSS; green), and a negligible ‘other’ (no DNAse HS peak but with GRO-cap TSS; blue; n = 4703). (g–i) These three classes represent a progression in terms of functional activity, as measured by (g) an increase in detectable transcription factor footprints (Wellington footprints on DNAse HS,), (h) chromatin links (ChIA-PET overlap,) and (i) a significant reduction in CpG methylation between each transition The center line of the boxplot represents the median, the boxes encompass the interquartile range, and the whiskers extend to the minimum and maximum.

