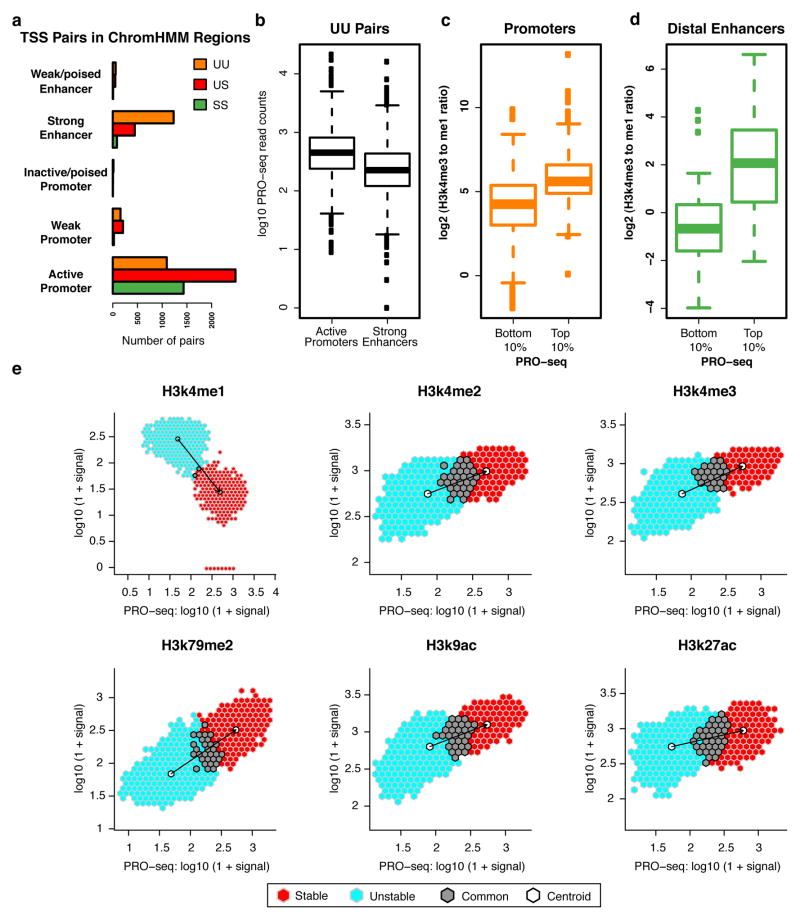
Figure 4. Histone marks at enhancers and promoters scale with Pol II intensity.
(a) Number of TSS pairs from each stability class mapping to different regulatory regions as designated by ChromHMM. (b) UU pairs mapping to active promoter regions (n = 1478) have a higher PRO-seq signal than those mapping to strong enhancer regions (n =3171), where active promoters and strong enhancers are defined by ChromHMM. (c-d) Ratio of mono- to tri-methylation of H3k4 at top and bottom deciles of PRO-seq signal in both (c) promoter (n = 247, 248; top and bottom deciles, respectively) and (d) enhancer TSS regions (n = 91 and 97; top and bottom deciles, respectively). (e) PRO-seq signal versus indicated histone modifications at TSS regions. Signal is further split between TSSs classified as unstable (light blue), stable (red), and points that overlap between the two (grey). Centroid for each subset in white.

