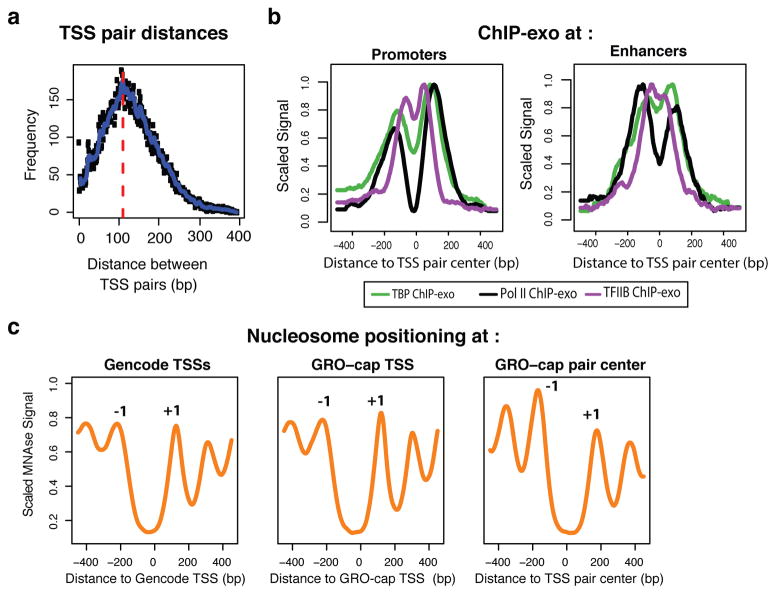
Figure 5. Architecture of TSS pairs.
(a) Divergent TSSs are tightly packed, with an estimated 110 bp inter-TSS distance, as estimated from the overall distribution of opposing strand read distances. (b) ChIP-exo profile26 for Pol II (black), TBP (green) and TFIIB (purple), centered on TSS pairs and split between promoter (top) and enhancer (bottom) regions (ChromHMM). (c) Mnase-seq profiles at protein-coding promoters, aligned either by GENCODE annotations (left; also positive for GRO-cap signal), GRO-cap TSS at GENCODE promoters (center), or to GRO-cap TSS pair centers (right). Peaks corresponding to -1 and +1 nucleosomes are indicated.

