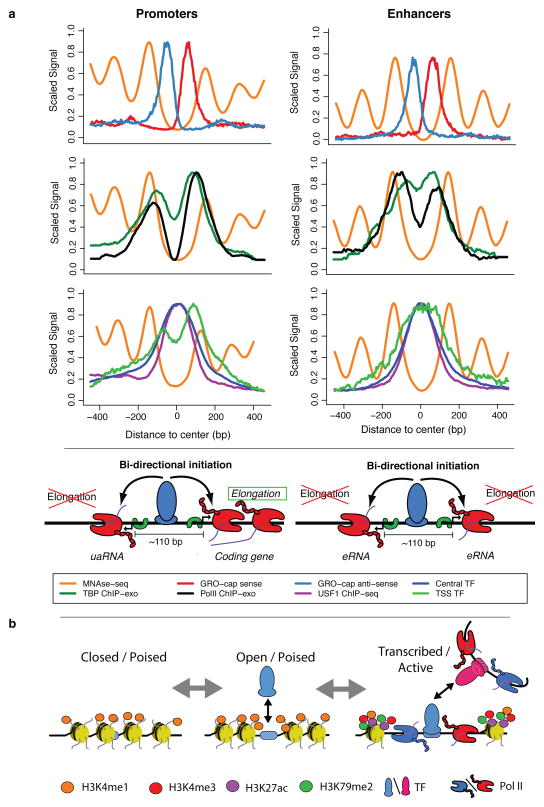
Figure 8. Summary of transcription initiation at regulatory regions.
(a) Our analysis of TSSs reveals a common structure across all initiation regions, including promoters and enhancers. In both cases, (first row) a tightly packed (110 bp \apart) divergent TSS pair (+ strand: red, − strand: blue) surrounded by well-positioned nucleosomes (orange), with independent pre-initiation complexes (separate TBP (green) and Pol II ChIP-exo peaks (black), second row) and sharing two distinct transcription factor cluster binding modes (central: green, over TSS: blue; third row). We propose that central, activator transcription factor binding (USF1 example: purple), in conjunction with core promoter elements, determines the positioning of the divergent initiation sites. Finally, DNA sequence properties (not depicted here), possibly in cooperation with other factors, determine the resulting transcript type (stable/elongating: protein coding, unstable/terminating: uaRNA, eRNA, etc.). (b) A model depicting possible progression of enhancer states from chromatin marked but largely inaccessible regions (left), followed by more open regions through transcription factor binding (center) and finally, active transcription, which brings with it the associated chromatin marks (in particular, H3K79me2 and H3K27ac and increased methylation levels of H3K4; right).

