
Figure 2. 8-oxoG inhibits peptide-bond formation.
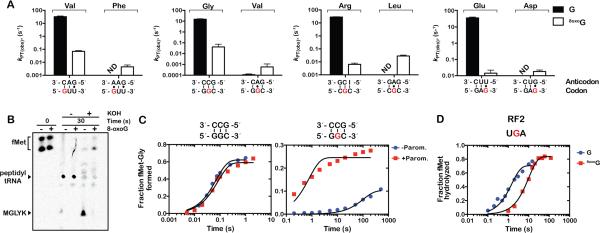
(A) Observed rates for peptidyl transfer (kPT) measured on native (GUU, GGC, CGC, GAG) and 8-oxoG complexes (8-oxoGUU, G8-oxoGC, C8-oxoGC, GA8-oxoG) with cognate - left two bars in each graph - and near-cognate (A:G mismatches at the 8-oxoG position) – right two bars in each graph tRNAs. The codon-anticodon interaction is shown below the x-axis and the corresponding dipeptide is shown above the bars. Clear bars represent rates observed with native complexes; black ones represent those observed with 8-oxoG complexes. Reactions were carried out at least in duplicate ± SEM. (B) Phosphorimager scan of an electrophoretic TLC of reactions between native complex (GGC) or 8-oxoG complex (G8-oxoGC), which encode MGLYK peptide, and the full complement of aa-tRNAs, elongation and release factors (PURE system, NEB). Reactions were allowed to proceed for 30 seconds before addition of 100mM KOH. (C) Time-courses of peptide-bond formation between the native GGC complex and Gly-tRNAGly (left panel) or oxidized G8oxoGC complex and Gly-tRNAGly (right panel) in the absence (blue circles) and presence of paromomycin (red squares). (D) Time-courses of RF2-mediated release on native UGA (blue circles) and U8-oxoGA (red squares) initiation complexes.