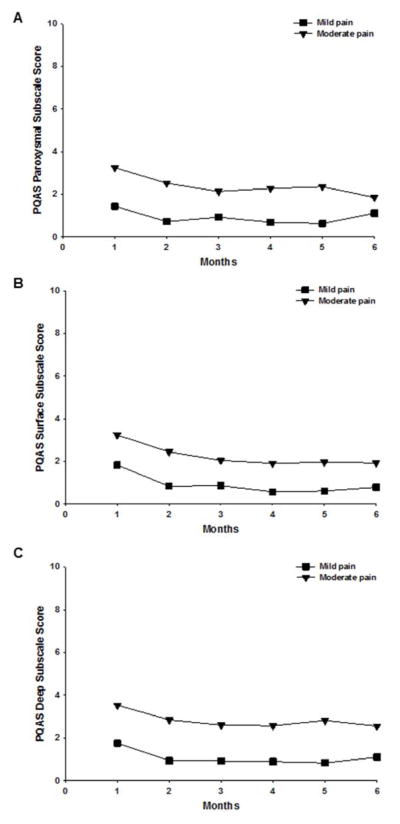
Figure 3.
Plots of the estimated marginal means over time between the arm pain classes for the mixed effects models for the Pain Qualities Assessment Scale (PQAS) Paroxysmal (A); Surface (B); and Deep (C) subscale scores between the arm pain classes. Statistically significant findings: Group and time effects for Paroxysmal, Surface, and Deep, all P < .001.

