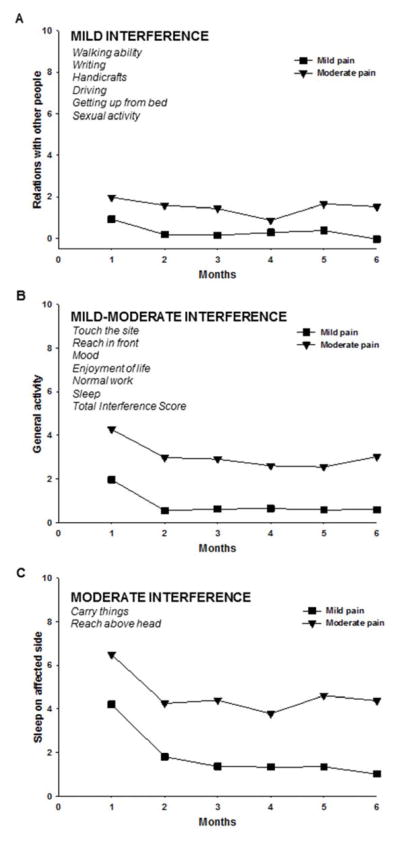
Figure 4.
Plots of the estimated marginal means over time, between the arm pain classes, for the mixed effects models for pain interference scores. Each of the panels displays an exemplar plot for the pain interference items that demonstrated: (A) mild interference (≤ 2); (B) mild-moderate interference (2.1 – 3.9); (C) moderate interference (≥ 4), based on the average pain interference score across time for the Moderate Pain class.

