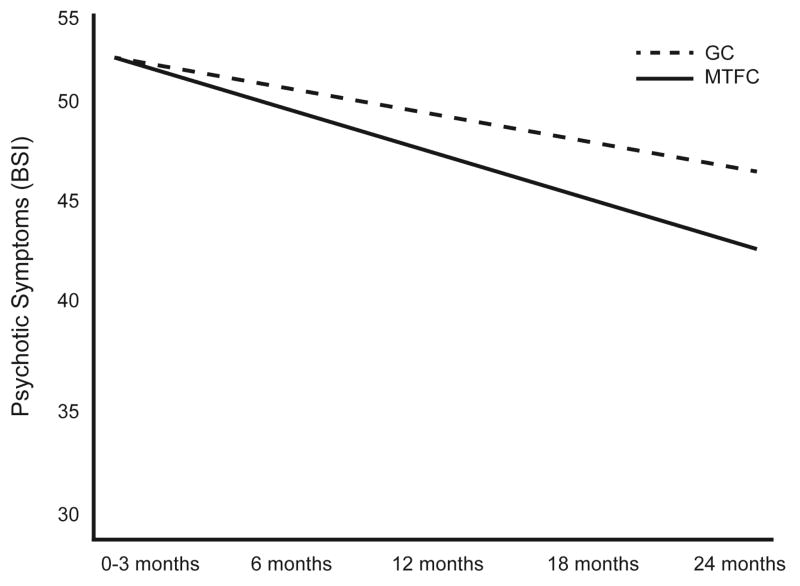
Figure 2.
Psychotic symptoms (Brief Symptom Inventory [BSI]) by group according to the growth curve analysis (see Table 2). Note: The graph assumes individuals with average (group mean) assessment intervals. GC = Group Care; MTFC = Multidimensional Treatment Foster Care.

