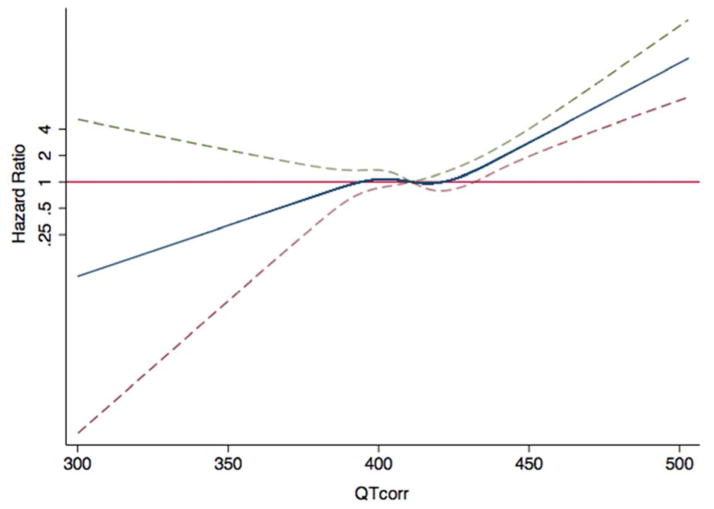
Figure 2. Hazard Ratios for CVD as a Function of the QT Interval.
The blue line indicates multivariable-adjusted hazard ratios for cardiovascular disease (CVD) endpoints as a function of QTcorr using restricted quadratic splines. The dashed lines delineate the upper and lower 95% confidence intervals. The horizontal red line indicates a hazard ratio of 1. Adjustment factors are described in Figure 1.

