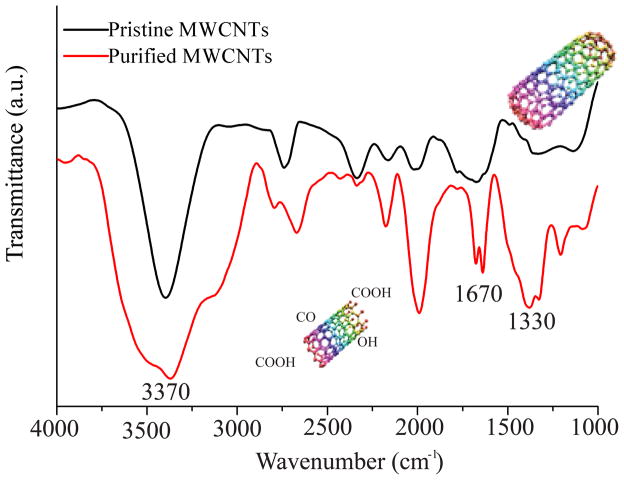
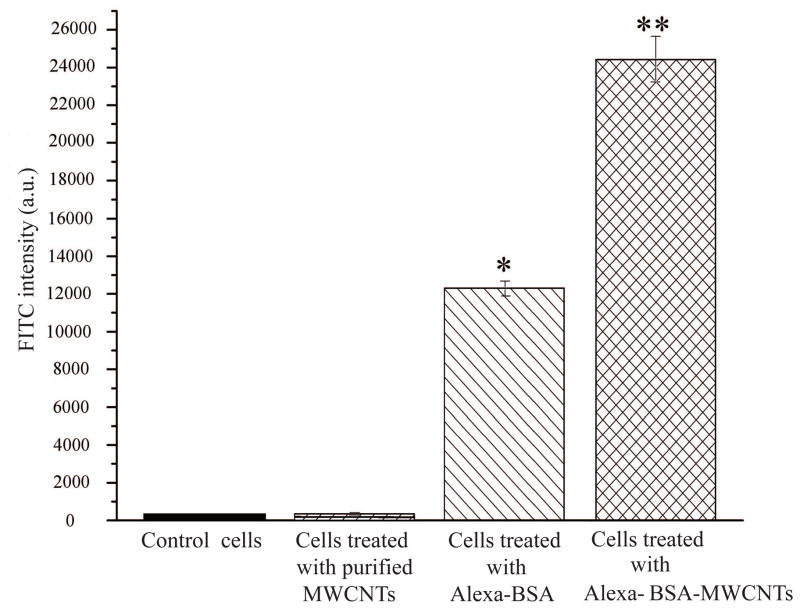
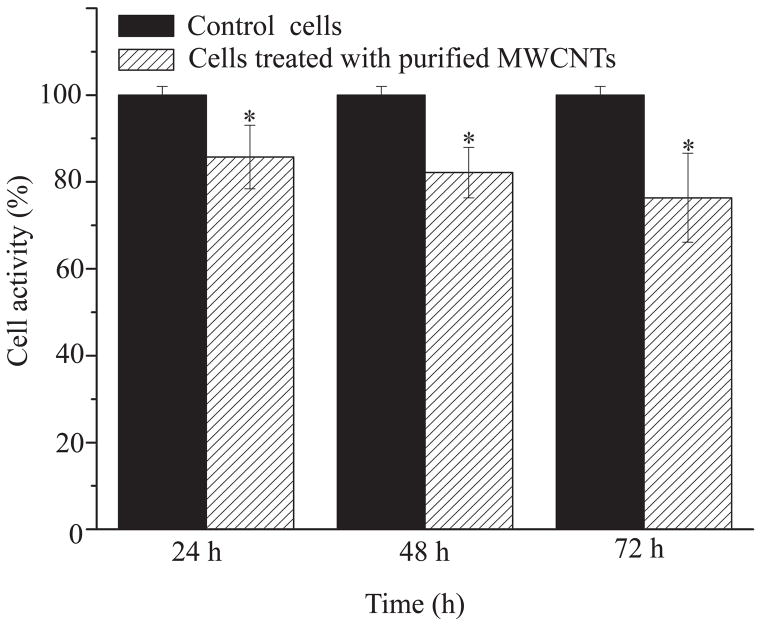
Figure 1.
(a) FTIR spectrum of pristine MWCNTs and purified MWCNTs (n=6). (b) FITC intensity of control cells, purified MWCNTs, BEAS-2B cells treated with Alexa-BSA and cells treated with Alexa-BSA-MWCNTs conjugates (n=9). (c) (%) Changes in the activity of the cells exposed to 24 μg/cm2 purified MWCNTs. Changes are considered significant for p*<0.05.


