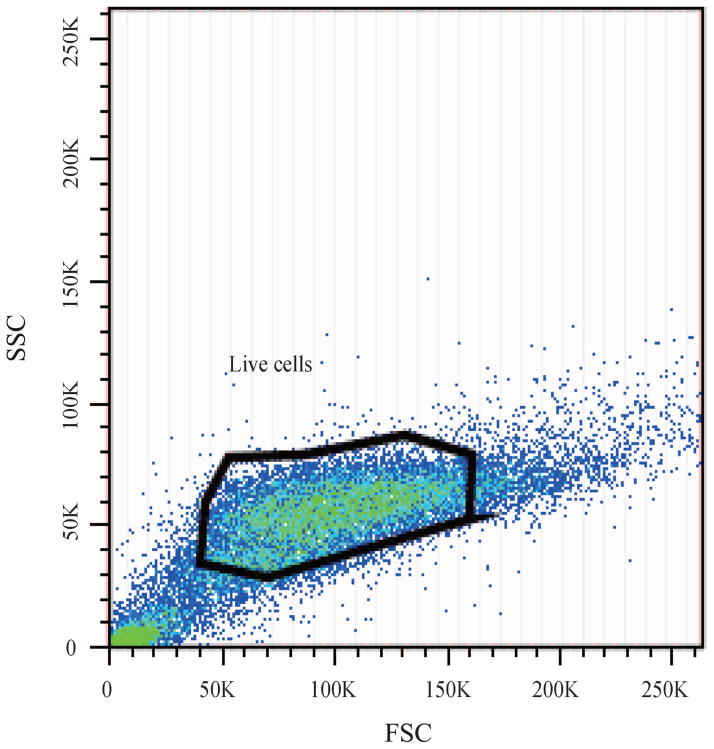
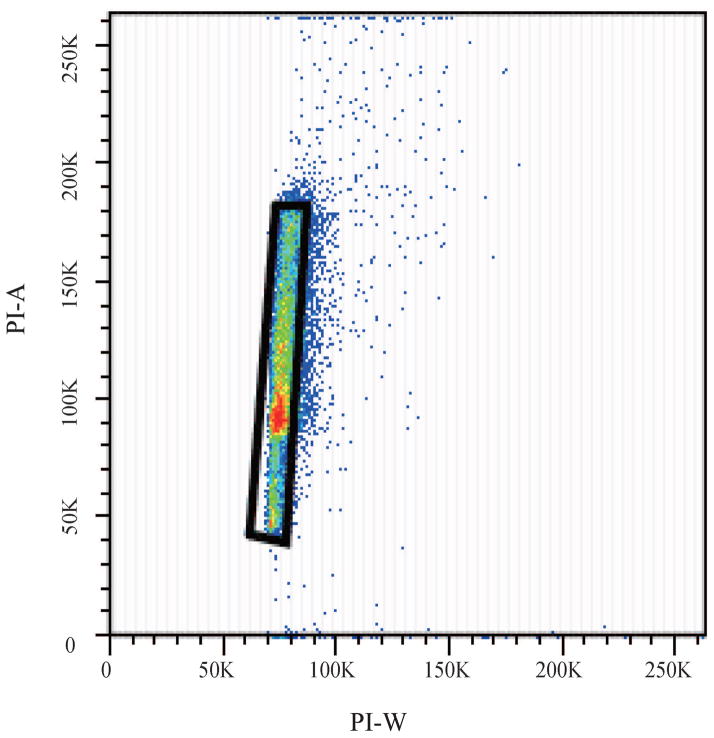
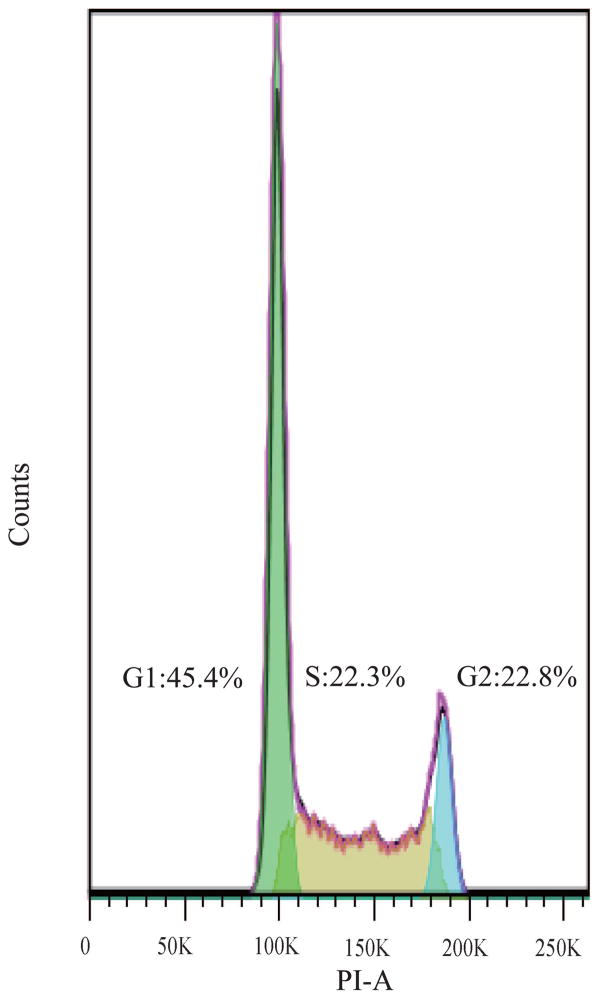
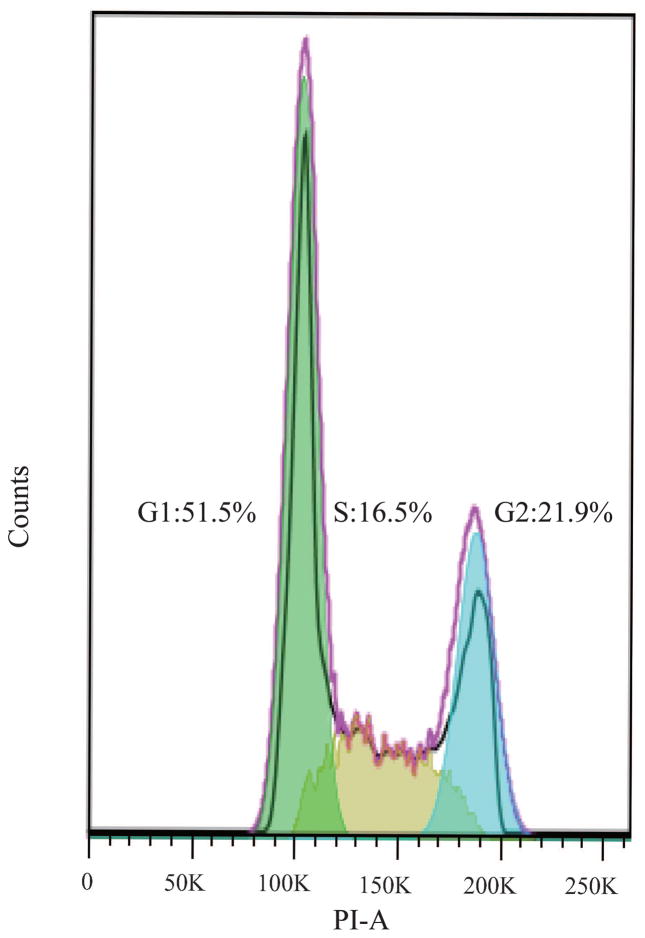
Figure 2.
Fluorescence Activated Cell Sorting (FACS) was used to evaluate the changes in cell cycle upon exposure to purified MWCNTs; PI-stained BEAS-2B cells were used. (a) Forward scatter (FSC) and side scatter (SSC) 2D-plot showing a representative gating of the live cell population. (b) Scatter plot selection of single cells; representative gating. (c) Cell cycle analysis of controls cell and (d) cells exposed to purified MWCNTs respectively.


