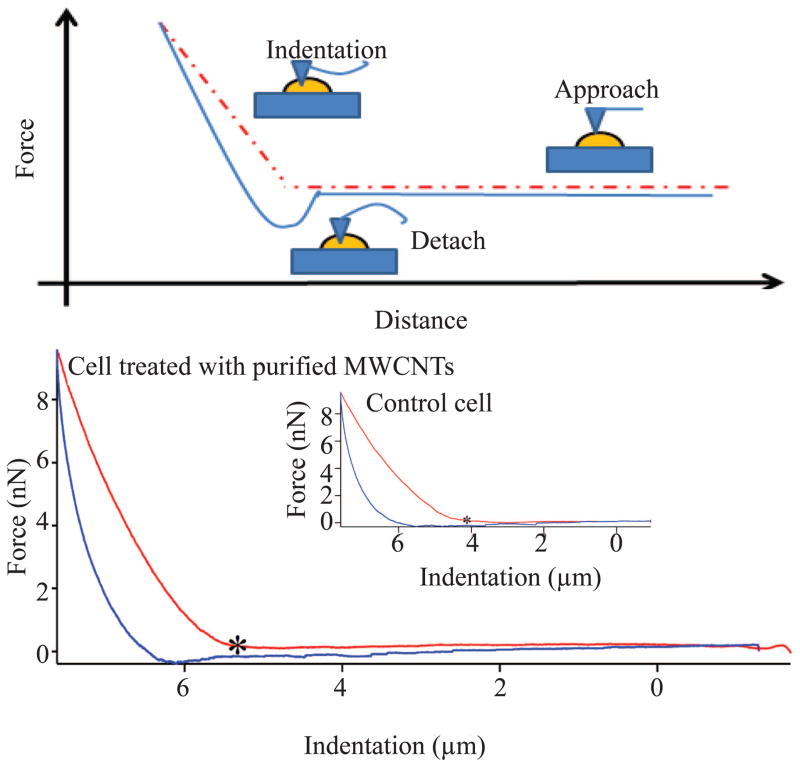
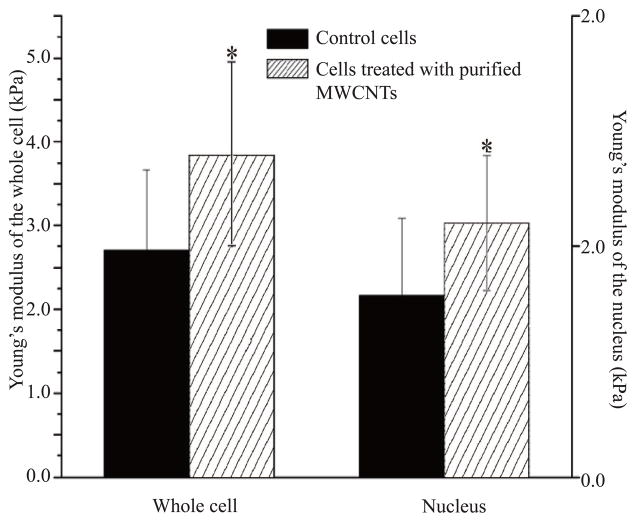
Figure 3.
(a) Schematic diagram of the force–indentation profile of control and cell exposed to purified MWCNTs. The red curve follows the approach of the tip to the plastic surface while the blue curve follows the detachment of the tip from the surface. “*” indicates the point at which the tip deflected from the surface to allow acquisition of the force-indentation measurement profile. (b) Average Young modulus of the whole live cell and the nucleus region of control and live cells exposed to purified MWCNTs for 24 h. All differences were considered statistically significant for p* <0.05.


